Chart types and timeframes
Change the source interval and choose a price presentation.
The timeframe decides which source candles are loaded. Candle type decides how their prices are drawn. Changing one does not replace the other: a one-minute Renko chart still builds its bricks from one-minute source closes.
Choose an interval and style
- In the chart’s upper-left toolbar, click the current interval, such as 1 m.
- Choose a preset: seconds, minutes, hours, day, week or month. For a custom interval, enter a positive whole-number Amount, choose the Unit, then click Apply.
- Click the candlestick icon immediately to the right of the interval and choose a type. Scroll inside the list for its lower entries.
- For Line Break, Renko, Kagi or Point & Figure, open the header gear → General to set its parameters.
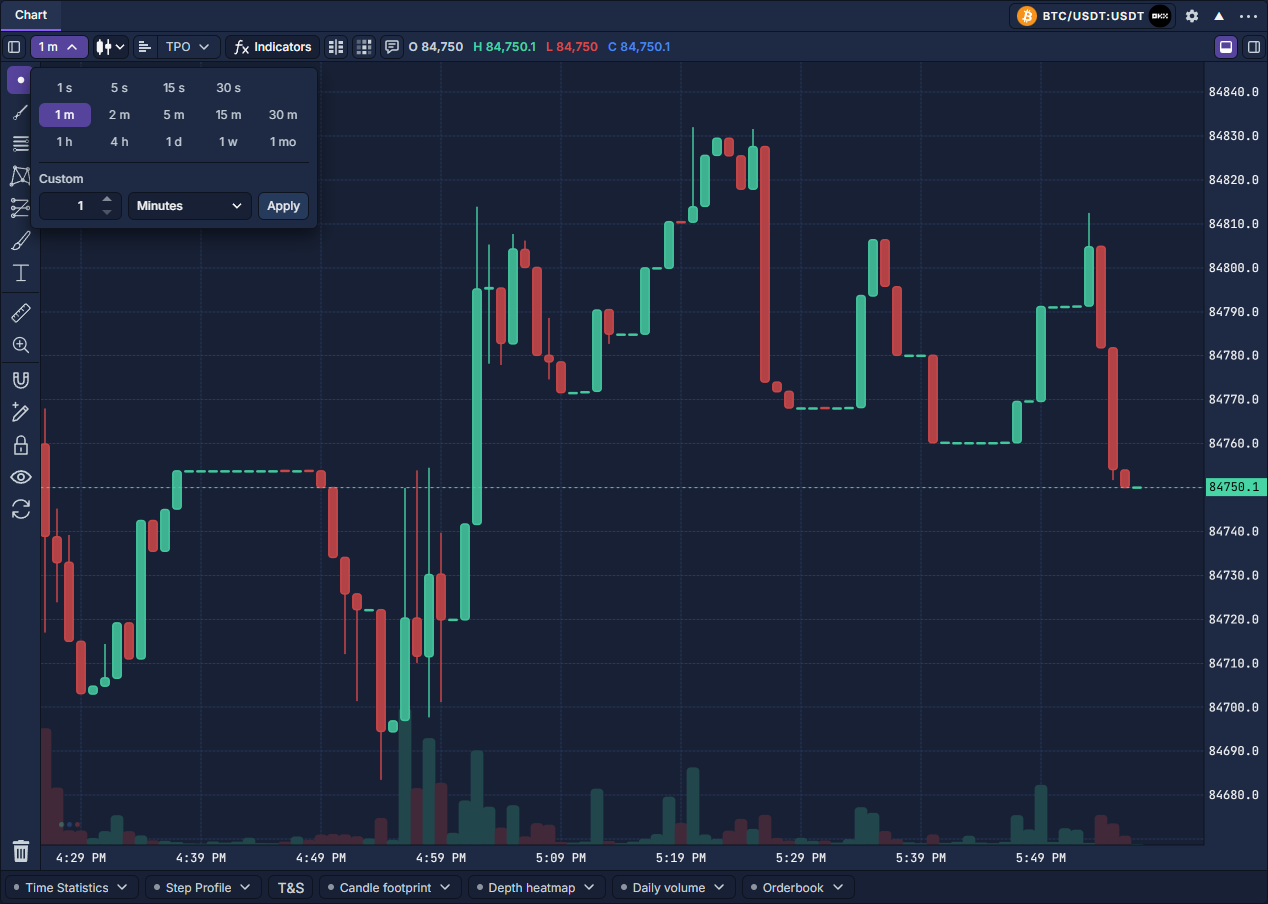
A longer interval summarizes more activity in each source candle. A shorter one exposes more detail but requires corresponding history from the provider. Footprint enrichment uses minute-based source data; second-based selections do not enable the footprint toolbar button. The time axis displays the chart’s timestamps, including irregular spacing in price-based views.
What each style shows
Set price-based parameters
For Renko and Point & Figure, disable Automatic size to enter Box size in price units, not ticks. Kagi uses Reversal amount instead. Automatic sizing uses 0.1% of the first loaded close, rounded upward to the instrument tick. A fixed value makes comparisons across loaded ranges easier.
These are calculated shapes from candle closes, not individual trades. Their horizontal positions do not imply equal elapsed time, and switching source timeframe can change the result. Return to Candles when you need the original OHLC view. Chart: navigation, controls and settings · Chart volume and depth tools