TPO settings
Configure aggregation, appearance, levels, colors and profile statistics.
Open TPO using the text-and-arrow half of the upper chart toolbar control. The icon half enables the profiles. Keep a profile visible while changing settings so you can relate each option to its effect. TPO: reading and working with a profile explains the profile itself.
- Open TPO → General and set the bracket interval, profile period and history.
- Set the price grouping before comparing levels.
- Use Style for the representation and Levels for analytical marks.
- Choose the session calendar in Sessions. Add execution-based information in Volume only when you need it.
- Finish with Colors and Statistics. Use the tab arrows when the rightmost tab is outside the available width.
General: time and price grouping
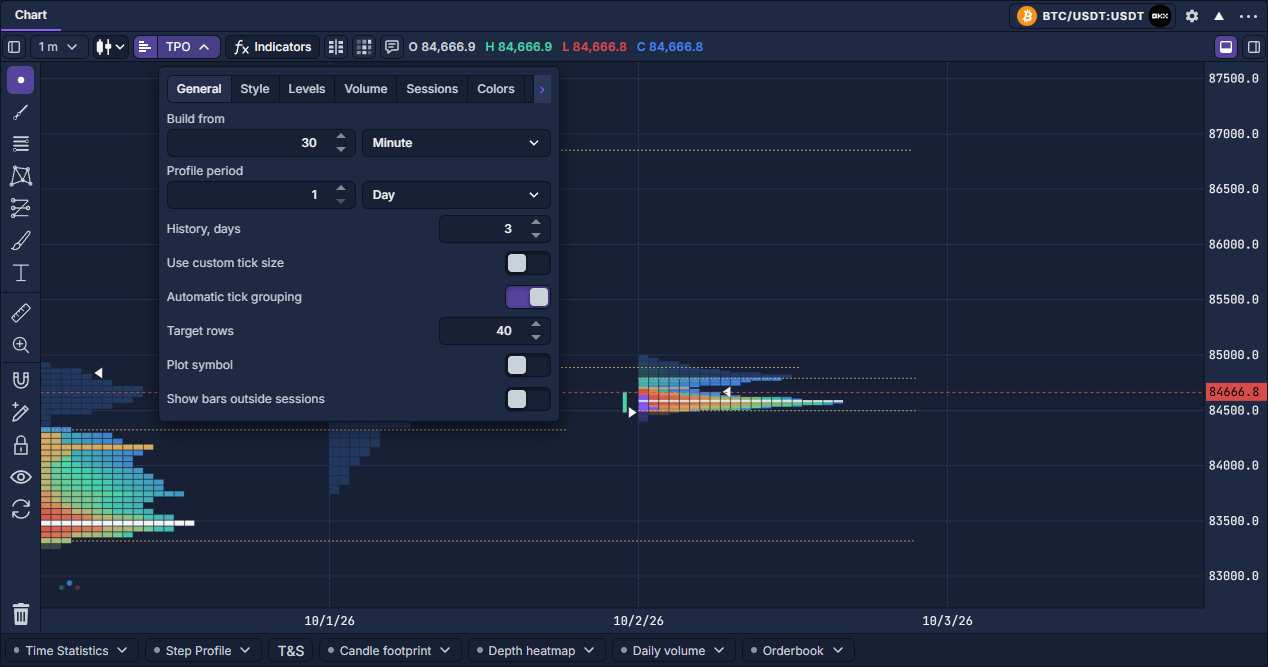
Changing row grouping can change POC and value-area boundaries. Record the grouping when comparing screenshots or profiles.
Style: shape and color meaning
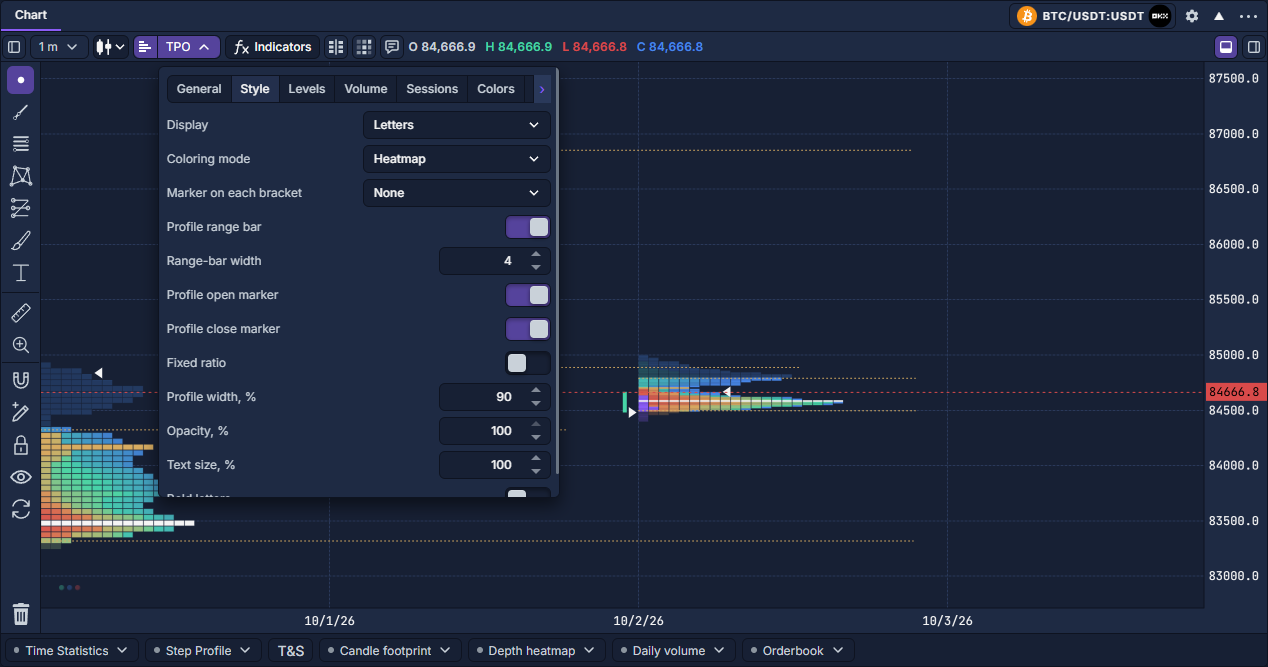
Letters displays bracket characters where there is enough room. Boxes emphasizes occupied cells. Zoom in or reduce the row count when individual characters do not fit.
The ten coloring modes answer different questions:
Marker on each bracket can show its open, close, both, or neither. Calculation range bar, its width, and the profile opening/closing markers are separate controls.
Fixed ratio locks the cell aspect. Profile width changes the horizontal allocation, Opacity changes transparency, and Text size and Bold letters change glyph appearance. These display controls do not change the underlying observations.
Levels: POC, value area and initial balance
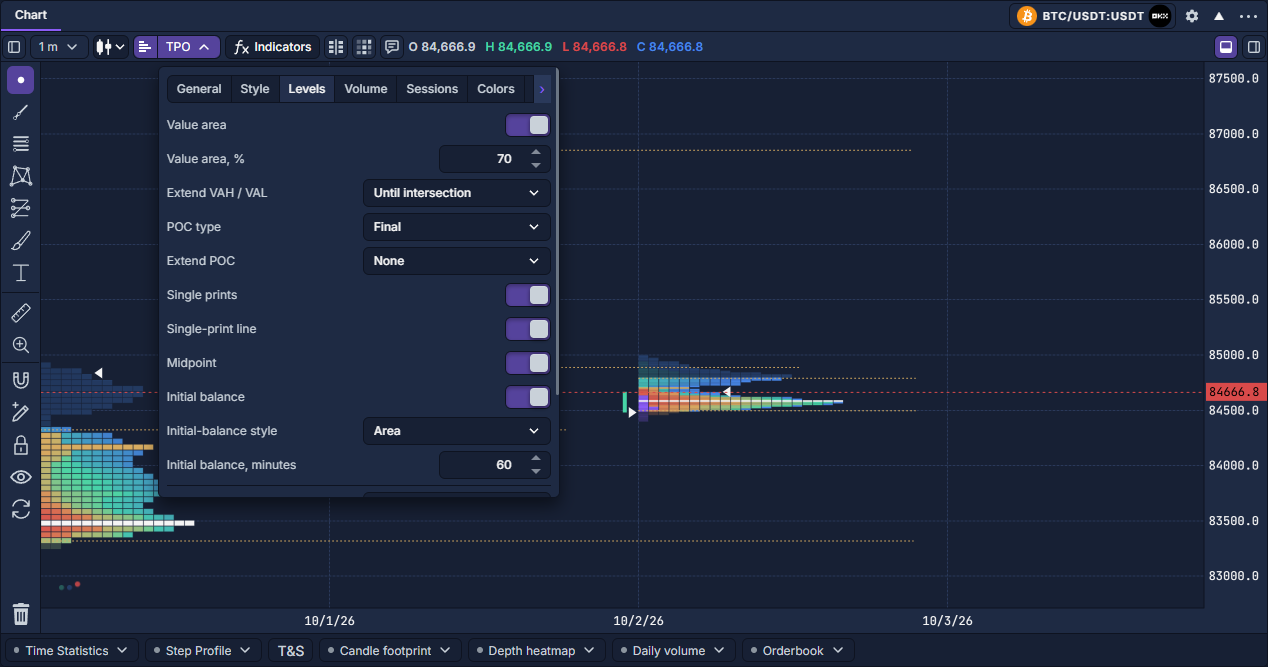
Value area enables its highlighting. Value area, % sets the coverage target. Extend VAH / VAL determines how its boundaries continue beyond the profile.
POC type is None, Final, or Migrating. Final marks the completed/current distribution's POC row. Migrating highlights the then-current POC in chronological cells as the profile develops; it is not a separate staircase indicator.
Extensions can stay within the profile (None), continue as a Ray, stop at the Until next profile, or stop Until intersection. Intersection uses observed price history; missing history cannot establish a future touch.
Single prints controls interior single-visit rows. Single-print line adds their line representation. Midpoint highlights the middle price row.
Initial balance uses the first configured number of minutes of the main session. Choose Bar for a side marker or Area for highlighted cells. Set its duration in minutes.
Select a role under Line to style to change its color, width and pattern where offered. The midpoint has a color control because it highlights a row. A selected profile's Extend POC action is a separate per-profile ray; see TPO: reading and working with a profile.
Volume and Sessions
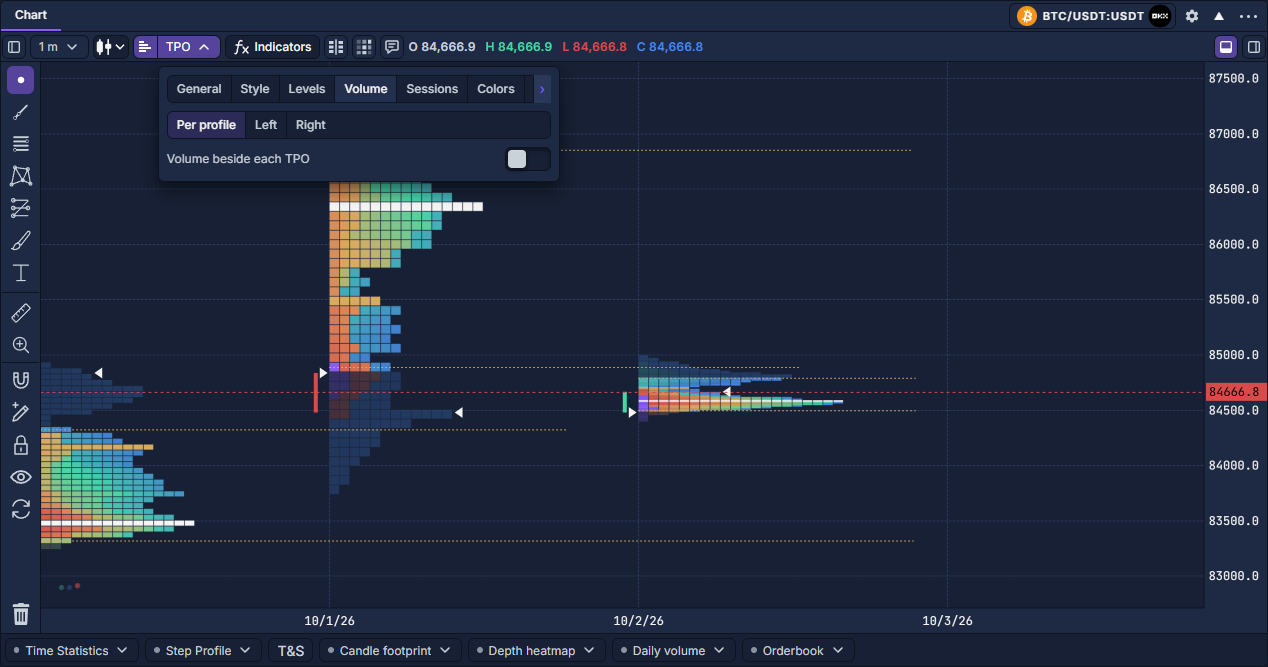
Per profile attaches a companion histogram to each TPO period. Left and Right configure independent profiles at the chart edges. Their ranges need not match the TPO period. Turn on the selected tool to reveal its metric, interval, histogram, labels, POC and value-area settings. Follow TPO volume profiles for a worked comparison.
Sessions selects included pre-market, main and post-market intervals and their time zone. A wrong calendar changes the profile boundaries and the initial-balance anchor. Follow TPO sessions and templates to create and save a template.
Colors and Statistics
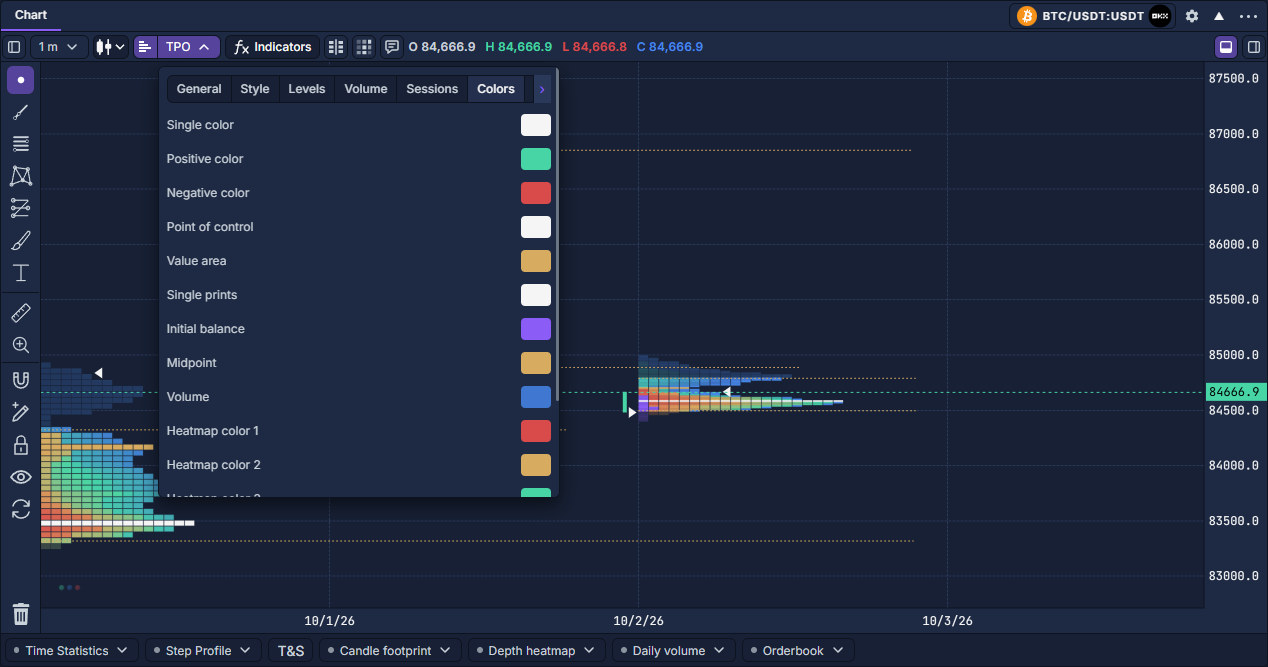
Colors sets the single, positive, negative, POC, value-area, single-print, initial-balance, midpoint and volume colors, plus the heatmap sequence. Use theme colors restores theme-based colors, including level, histogram, label and statistics color overrides.
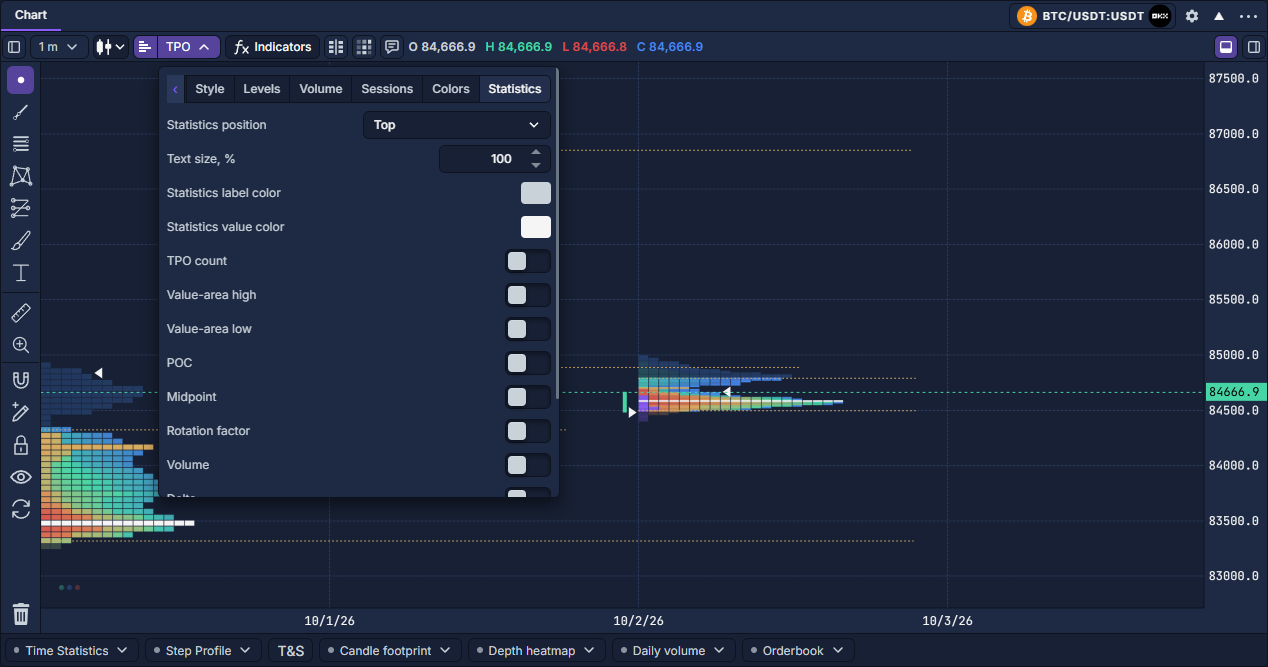
Statistics can show TPO count, VAH, VAL, POC, midpoint, rotation factor, volume, delta, trades, date and time. Rotation summarizes successive brackets' high/low progression. It is distinct from the profile's price change.
Choose Top or Bottom, text scale and label/value colors. The compact strip follows the hovered or selected profile, with the latest visible profile as its fallback. Select only the fields you want to read. Volume, delta and trades depend on the available execution data.