Chart: navigation, controls and settings
Find the chart tools, inspect candles, restore the view and choose the right settings.
The Chart panel shows the selected instrument’s price history. Its toolbars add indicators, drawings, executed-volume analysis and current or recorded order-book depth. Start with a normal candle view, then add the information needed for your task.
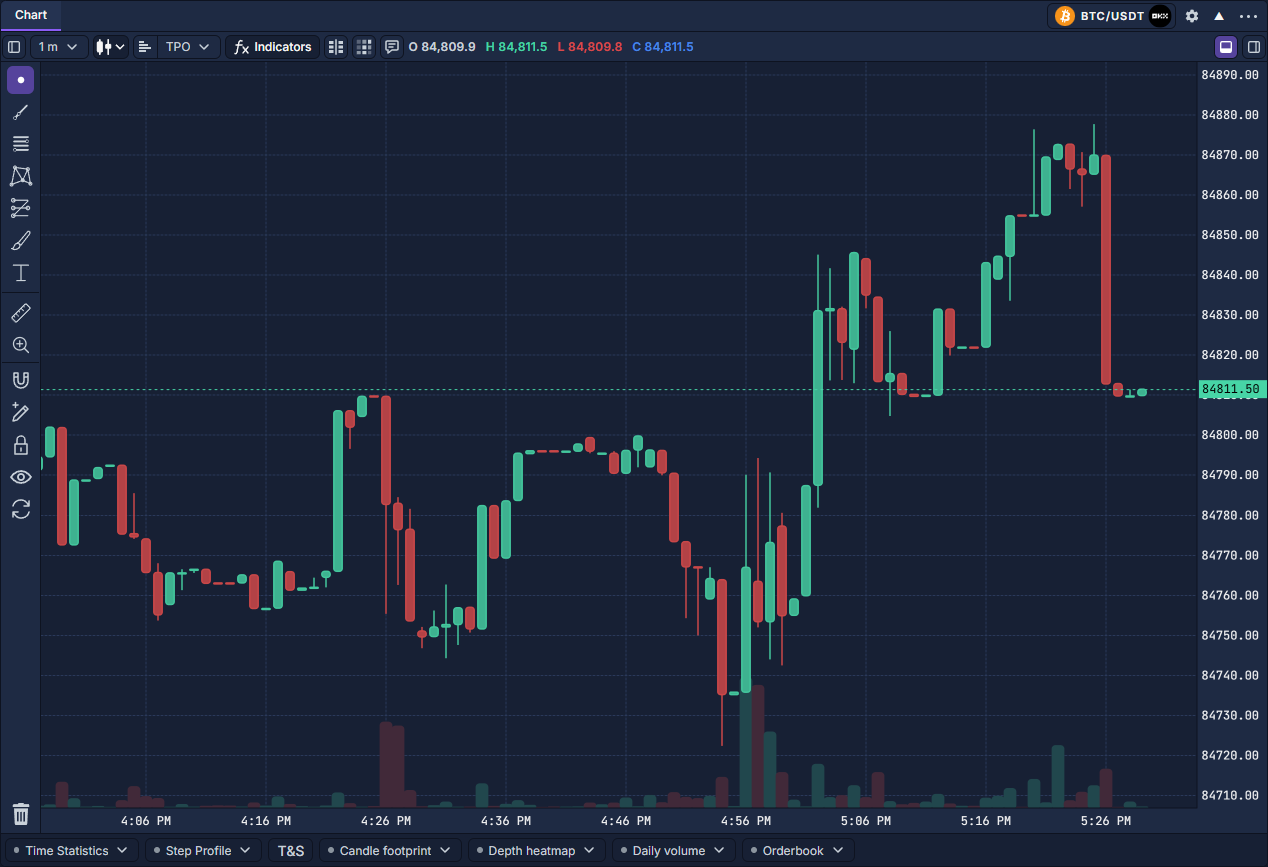
Open your first chart
- Click PANELS → Chart. The panel picker is illustrated in Add and organize panels.
- Click the instrument button at the right of the panel header and select a market and provider. The symbol here is BTC/USDT:USDT; the provider icon distinguishes its source. See Select and link instruments.
- Click 1 m near the upper-left corner to select a timeframe. The candlestick icon immediately to its right opens Candle type. Choose Candles while learning the controls.
- Read the price scale on the right and time scale below the plot. Green and red candles show the selected theme’s rising and falling colors. The smaller columns at the bottom show candle volume.
- Move the pointer across a candle. The upper O, H, L, C ribbon shows its open, high, low and close. The last-price label on the axis is a separate value; an earlier candle’s close need not match it.
Find each control
Pan, zoom and return to the market
Drag the plot horizontally to inspect earlier or later bars. Turn the wheel over the plot to change horizontal zoom around the pointer. Zoom in when footprint numbers or closely spaced drawings need room; zoom out when comparing a longer sequence.
The navigation controls appear near the bottom of the plot while interacting with it: − / + zoom, the left and right arrows move through the series, and the curved Reset chart view button restores the chart framing. These controls belong to the plot, above the time axis.
Drag the price axis to adjust its vertical scale. A selects automatic price scaling; L switches logarithmic scaling. A logarithmic axis allocates distance by proportional price changes, so equal price differences no longer have equal height. Return to automatic scaling if prices have moved outside a manually chosen range.
Click the speech-bubble button before hovering when you want a detailed candle tooltip. Changing the cursor or hiding its tooltip does not change the underlying candles. A blank or unavailable interval is not evidence of zero trading; check the instrument, source and requested interval.
Use the lower analysis toolbar
Time Statistics, Step Profile, Candle footprint, Depth heatmap, Daily volume and Orderbook open settings popups. Opening one does not itself enable the feature: turn on its Enabled switch or the relevant profile slot. The small status dot indicates activation. Closing the popup keeps the selected feature enabled.
T&S opens historical executions for a selected candle. These are different from the streaming Time & Sales panel. The Lower toolbar button controls whether this row is visible, rather than clearing your analysis setup. See Chart volume and depth tools for the views and their reading workflows.
Change chart settings
Click the gear beside the instrument, then choose the appropriate tab. Changes preview in the chart; close the dialog with its X or Escape when finished.

Save reusable preferences through Reuse panel settings. The panel menu also provides Help and workspace actions; Add and organize panels explains exactly where to open it. Global language and theme preferences are in Application settings.