Price statistics
Compare execution volume and delta at each price in the current candle.
Price statistics groups executions by price within the current candle. It turns the candle's footprint into a sortable table so you can compare activity, trade sizes and buy/sell imbalance at each level.
Choose the candle and price grouping
- Open PANELS → Price statistics and select the listing in the panel header.
- Choose 1m, 5m, 15m, 30m or 60m in the toolbar at upper left.
- Set Aggregation step beside it. This is a multiple of the instrument's minimum price tick: with a 0.1 tick, a step of 10 groups prices in 1.0 increments.
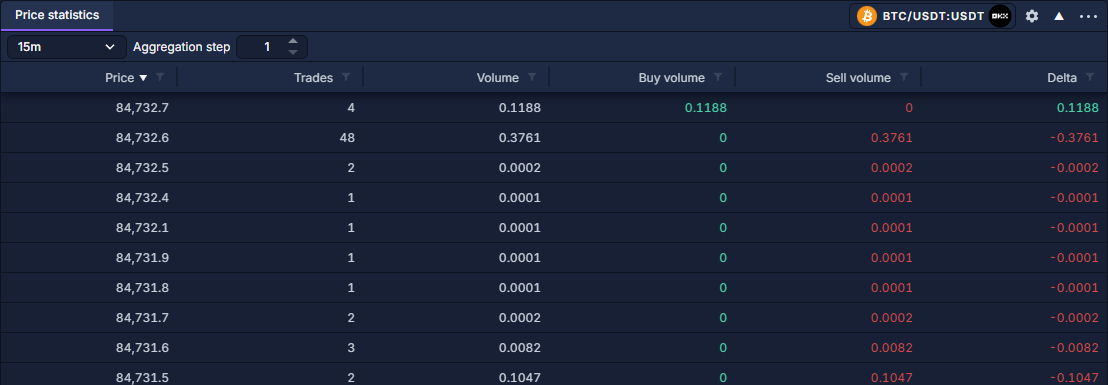
The table starts a new candle at each timeframe boundary. A 15-minute setting follows the current 15-minute candle; it does not accumulate the whole day.
Read and compare the columns
The default columns are Price, Trades, Volume, Buy volume, Sell volume and Delta. Volume sums executed base quantities. Delta is buy volume minus sell volume; a positive value means more buyer-initiated than seller-initiated quantity at that level.
Click Volume until the largest values are first, then compare the buy/sell split and delta on those rows. Return to Price sorting to inspect the distribution in price order. Column funnels narrow the table; see Work with data grids.
Select statistics and alerts
Click the gear in the panel header to open Settings. Change the required options, then use Apply; Cancel discards the draft.
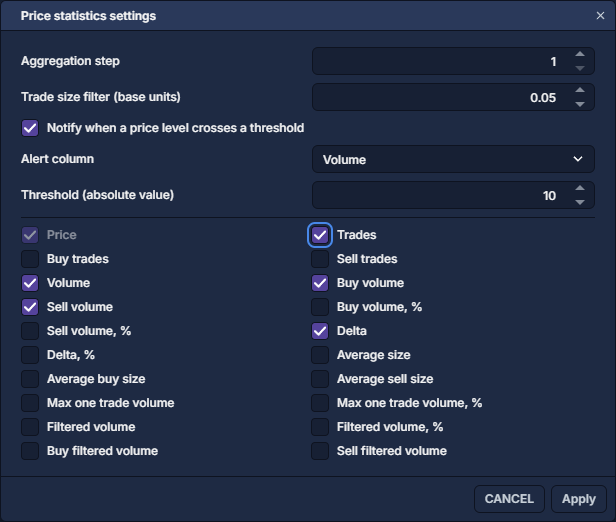
The checkboxes choose visible columns; Price always stays visible. A dash means a measure cannot be established from the available provider detail.
Enable Notify when a price level crosses a threshold, choose Volume, Delta, Max one trade volume or Filtered volume, and enter the absolute threshold. Alerts watch subsequent crossings after the initial values are established; enabling them does not announce every existing large row.