DOMTrader columns and volume profiles
Choose ladder columns, distinguish their calculations, and build a profile for a specific interval.
Every ladder column is aligned to the displayed price row. Choose columns for the question you want to answer: resting liquidity, recent executions, execution volume over a period, your orders or your position.
Open the column menu
- Right-click a column heading, such as Volume in the screenshot. A normal left click does not open this menu. Keyboard users can focus the heading and press Shift+F10.
- Tick a column to show it. Drag headings to reorder them and their edges to resize. Fit all columns to panel shares the available width; Fit column width to content fits the selected column.
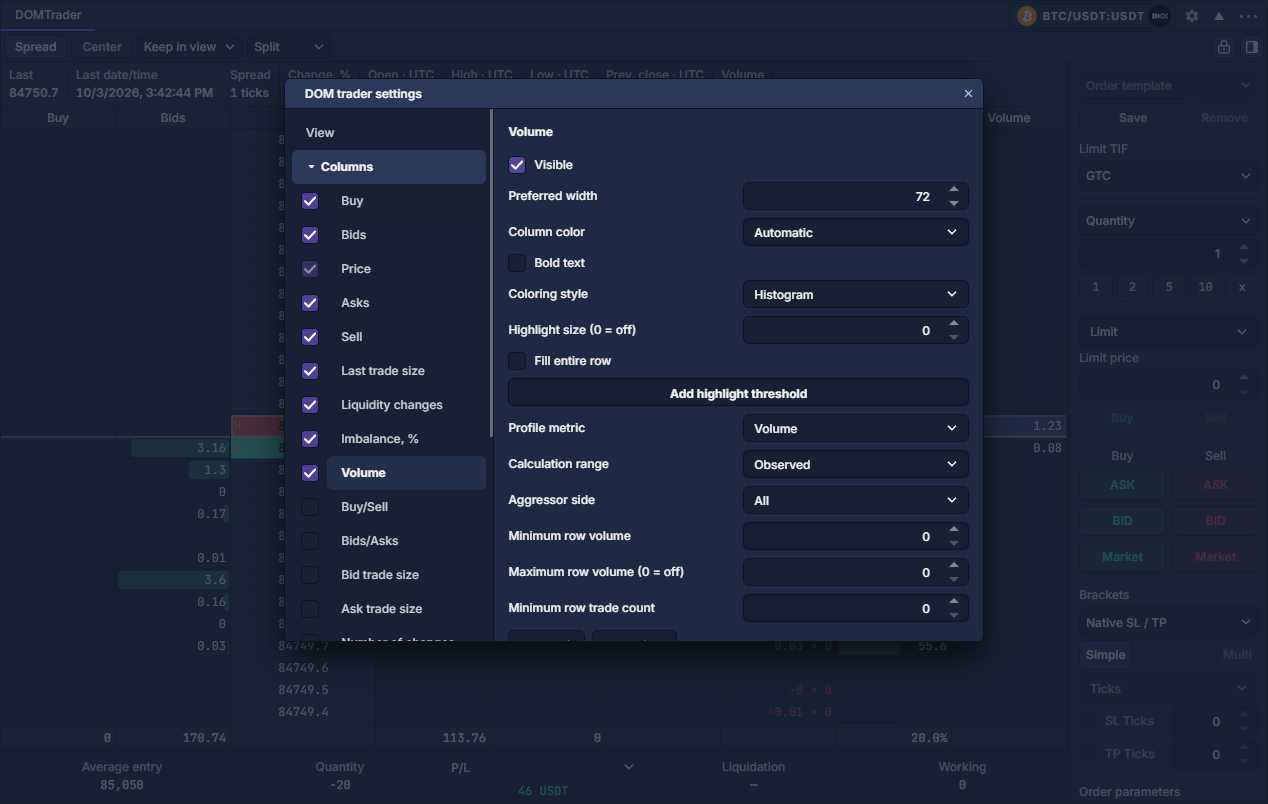
- Choose the selected column's Settings item, or open the panel-header gear → Columns, then click that column in the left list.
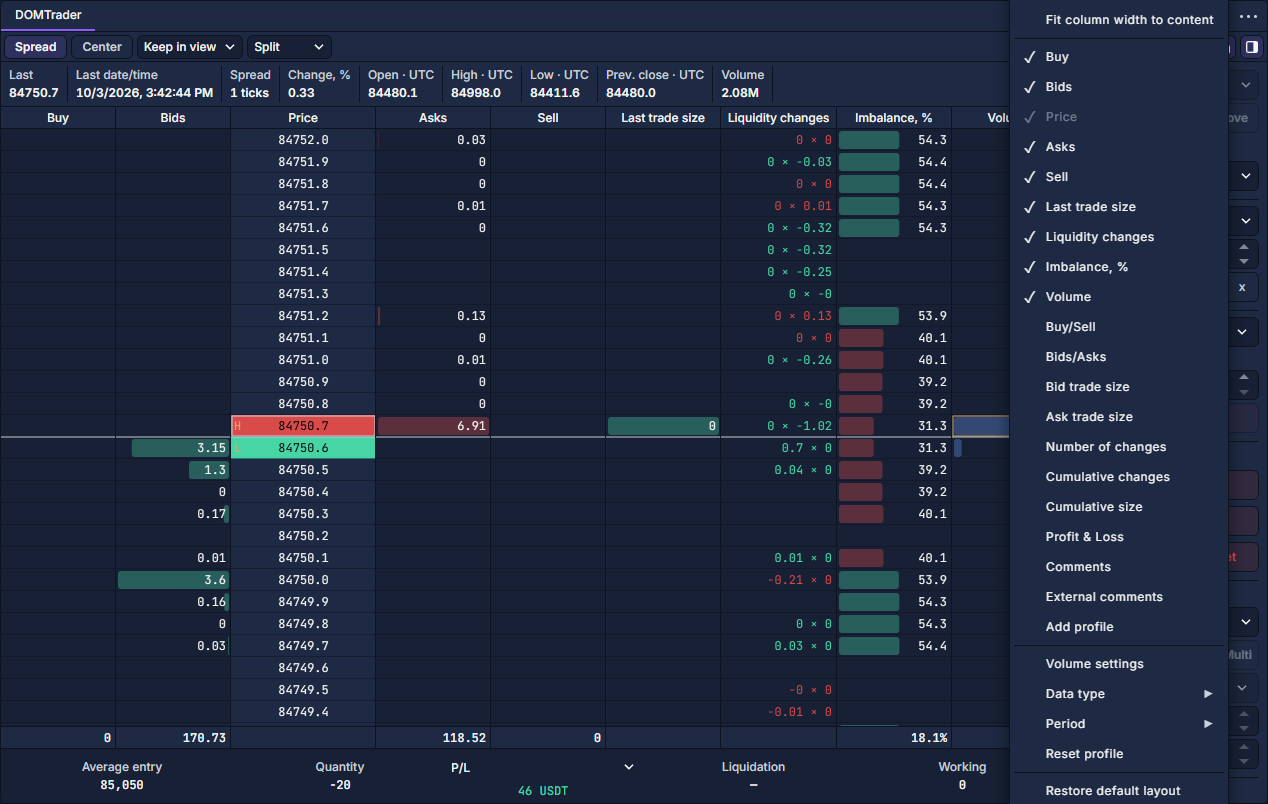
Resting depth and changes
Bid/ask columns show resting quantity. Cumulative size sums depth outward from each best quote. Imbalance pairs occupied bid/ask levels by rank and displays cumulative bid quantity / combined cumulative quantity as a percentage. The bottom summary is the model's signed whole-visible-book imbalance. Liquidity changes sum signed observed size differences; Number of changes counts accepted changes; Cumulative changes displays gross added + removed quantity.
Decreases do not prove cancellation or participant intent. Gaps, reseeds and changes to tick aggregation/unit restart the change baseline. Levels outside a truncated feed are not interpreted as canceled orders. Automatic time/price-distance resets affect change columns, including while hidden.
Recent trades and profile periods
Bid trade size is recent selling; Ask trade size is recent buying, using the provider's aggressor classification. Last trade size accumulates the unchanged-price trade streak, including unknown-side volume. Each recent column can reset independently by time, observation batch or manually. Profiles combine bounded live executions with available provider-confirmed footprint history: observed, rolling minute/hour, timezone day/previous day (UTC by default), configured session and custom UTC range.
Complete history buckets replace overlapping live observations, avoiding double counting. Header tooltips disclose coverage, missing history and count basis; incomplete ranges remain partial. Side, minimum/maximum volume and minimum count filters apply to aggregated price rows, not individual historical trades. Unknown-side volume contributes total volume but not directional delta. VWAP uses base quantity regardless of display unit.
UTC day OHLC and previous close use closed-minute provider candles; the active minute is excluded and these are not exchange-session settlement values. Ladder H/L markers still refer to retained observed trades. Stale depth is dimmed with an explanatory tooltip.
Configure a separate profile
- Choose Add profile from the column menu, or Add volume analysis column in Settings → Columns.
- Select the new column, then set Profile metric: volume, delta, buy/sell volume, trade counts, directional quantities, percentage shares or average size.
- Set Calculation range. Compare Observed with Last minute, 5/15 minutes, Last hour, Today, Previous day, Selected session or Custom range.
- For a session, enter its time zone, start/end and weekdays. For a custom interval, enter Start, UTC and End, UTC.
- Set aggressor side, minimum/maximum row volume and minimum row trade count. These are aggregated-row filters, not a filter that reconstructs individual historical trades.
- Choose histogram, gradient, combined or text-only display; set width, color, bold text and highlight thresholds. Compare the new profile with the first one. Up to eight profile columns can coexist.
Read position values
Currency and percentage position P/L use provider-reported values. Tick movement uses the provider mark and entry prices, excluding fees, quantity and execution effects. Liquidation price is shown only when supplied. The ladder P/L column shows indicative signed price distance from one position's entry in ticks per unit. Multiple positions are not combined into an invented entry price.
MBO, exact queue rank and individual-order counts require provider data that the current aggregated feed does not supply.
Reset a measurement
Each liquidity/change-count/cumulative-change column has independent manual, timed and native-tick reset rules. Global reset still clears all change columns. Independent baselines are invalidated on reconnect, reprojection or global reset and remain current while hidden. The position bar can show two provider P/L values simultaneously, each with its own display selector.
Add price comments
Enable Comments, then right-click the intended price row and choose Comment at…. Enter the text and confirm. Keep user comments separate from the External comments column, which is populated by import or an explicitly configured source.
Comments are plain text attached to instrument and price. External comments import CSV/TSV with Price,Comment columns, at most 500 levels / 128 KB. An explicit HTTPS source can refresh manually or periodically; {symbol} in the URL is replaced with the encoded instrument. Apply source commits the address, and failed refresh retains the last comments. Browser access depends on the source's CORS policy. Import replaces that instrument's external comments. Export writes user-authored comments only.
Panel settings and comments synchronize between local windows with version tokens and focus recovery. Named panel templates and workspace profiles are saved locally for guests and synchronize with the signed-in account. Required market/account resources remain active while the panel is hidden.
DOMTrader: read and use the price ladder · DOMTrader settings · Price statistics · TPO volume profiles