SmartDOM: footprint, tape and depth
Read the three aligned views, navigate prices and prepare a ladder action.
SmartDOM combines executed activity over time with the current resting order book. All three panes share a price scale: the footprint is on the left, trade bubbles and optional depth heatmap in the middle, and the current depth ladder on the right. The far-right order-entry sidebar is optional. This example uses live market data and an illustrative simulated position.
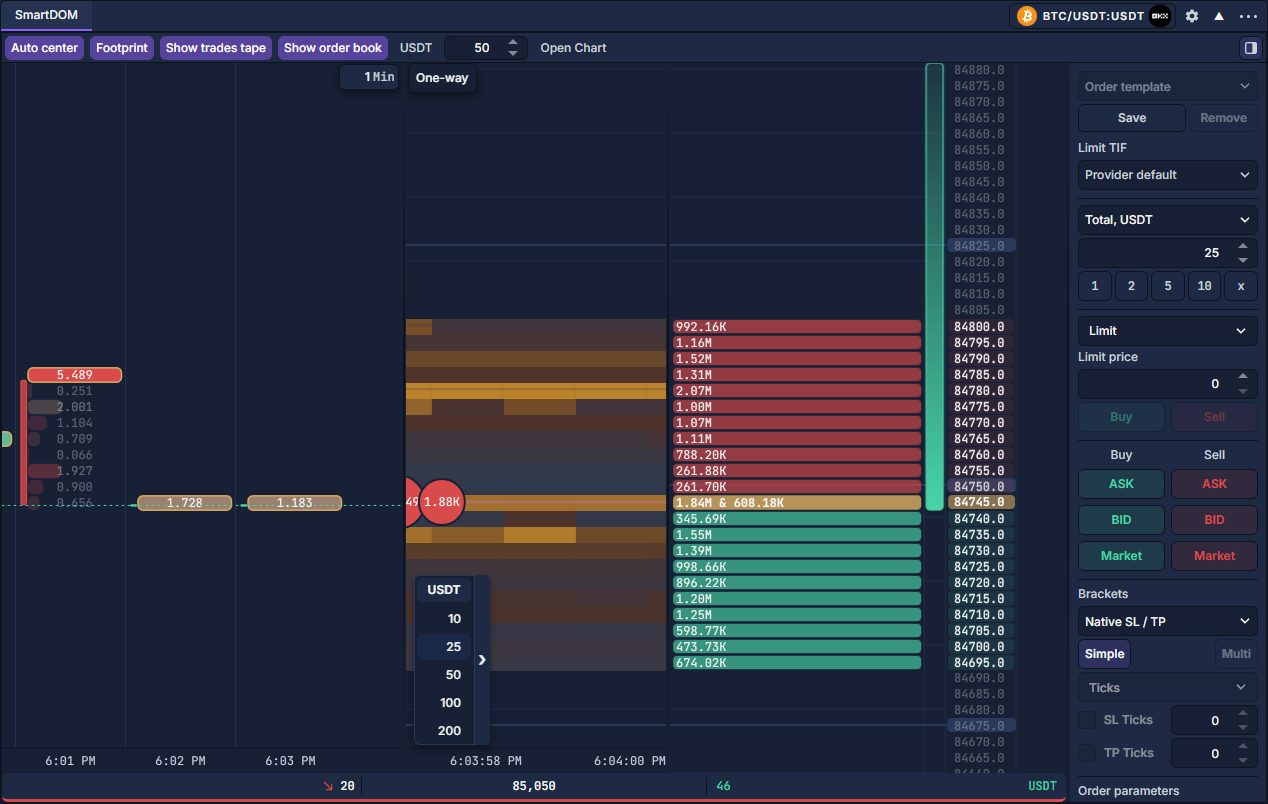
Open and identify the controls
- Click PANELS → SmartDOM, then choose the instrument in the panel header. Add and organize panels and Select and link instruments show the picker and instrument control.
- Use the second-row Footprint, Show trades tape and Show order book buttons to show the three panes. Purple buttons are active. Hiding a pane preserves its data processing.
- Click Auto center to follow the market; B is its default shortcut. The currency button beside the pane buttons changes the displayed size unit. The number beside it is price aggregation in native ticks.
- The small sidebar icon at the far right of this row opens order entry. The gear beside the instrument in the header opens Settings. Open Chart creates a separate chart for this instrument.
Read the three views
Footprint: each time column contains executions grouped by price. Its selected metric determines the numbers and colors. Here it shows signed volume delta: buyer-initiated volume minus seller-initiated volume. It is not resting depth. The small 1 Min field in the footprint’s upper-right corner sets its bar duration.
Central tape: bubbles are actual executions. Their size emphasizes traded amount; side colors distinguish buying and selling activity. The background heatmap records observed resting liquidity through time. A bright patch is depth, not a trade and not a guarantee that an order will stay there.
Right ladder: red ask quantities sit above green bid quantities. Prices align horizontally with the footprint and tape. The screenshot displays quote amounts in USDT and a 50-tick row grouping; for this instrument’s 0.1 tick, adjacent rows are 5.0 apart. Display aggregation does not change the instrument’s native order-price increment.
Navigate and inspect a short interval
- Start with Auto center active, then change aggregation from 50 to a smaller value to inspect finer price levels. Increase it again when you need a wider price range. The + / − shortcuts adjust aggregation.
- Scroll over the ladder to move through prices. B / Auto center restores following the market. Drag the separators between panes to give the footprint or tape more width.
- In the footprint, enter a duration from 1 to 30 minutes in its upper-right field. Drag horizontally to browse older bars; use the wheel over the footprint to change horizontal zoom. Its vertical scale continues to follow the ladder.
- To restore the footprint framing, right-click inside the left footprint pane → Reset view. Scroll to latest returns to current bars; Scroll to beginning navigates to the beginning of available chart history.
Turn on the depth heatmap
Right-click inside the central tape pane, then select Show depth heatmap. Its checkmark shows whether it is enabled; the adjacent gear opens heatmap settings. This is a different target from the order-book ladder, where right-click is a trading gesture. The context menu below is shown together with the pane it belongs to.
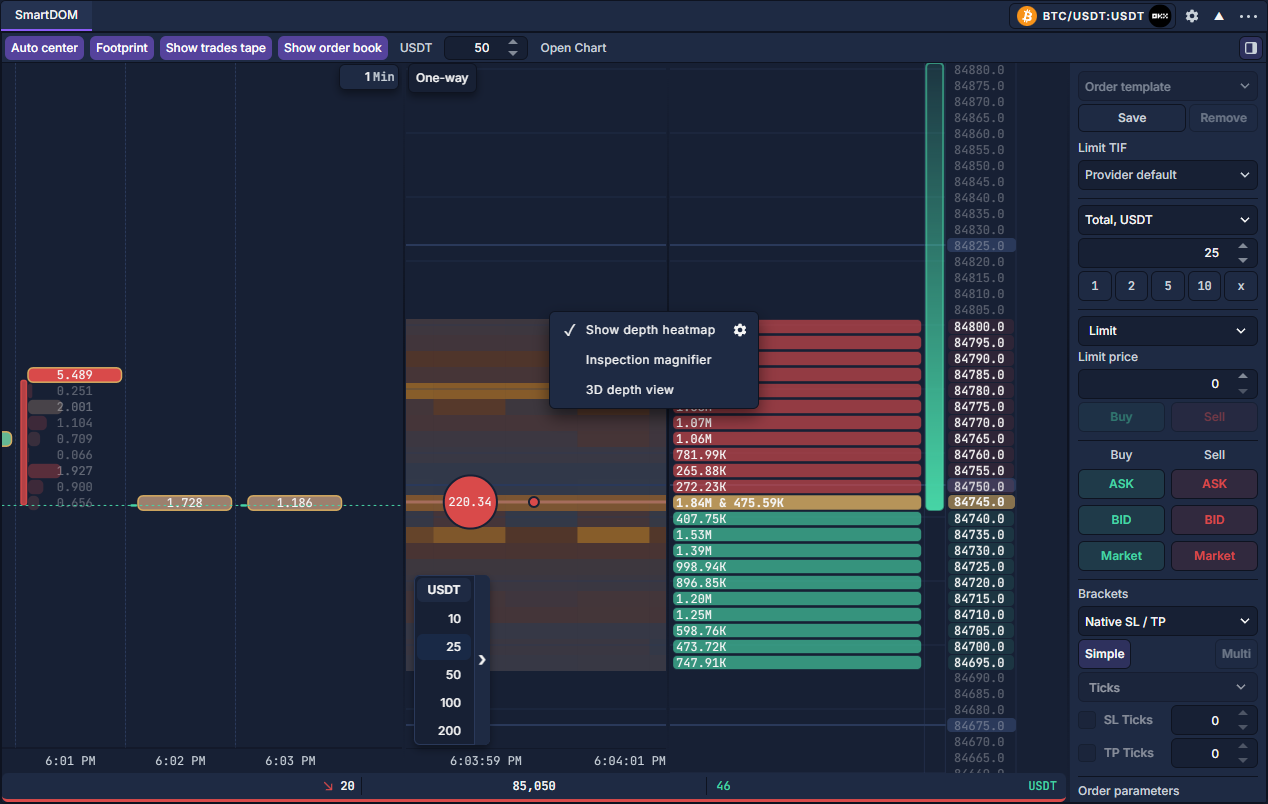
History starts when the heatmap is enabled and continues while its pane is hidden. Latest records the last observed depth in a time column; Maximum records each price level’s peak, which may have occurred at different moments. A gap is not proof of zero liquidity. Saved preferences do not create a historical depth archive. SmartDOM settings explains the controls.
Prepare a ladder action
Open the sidebar first and check the selected account, quantity unit, amount, time in force and protection. The five size presets are selected with 1–5. Changing the displayed depth currency does not replace this order review. Order Entry: prepare and review a ticket covers the shared ticket and confirmation.
These are default bindings; inspect Settings → Hotkeys for the current mapping. A right-click on the central tape opens its menu, while a right-click on the book can submit a sell action after the applicable checks and confirmation. Use a supported paper instrument for practice.
Interpret the position strip
Position rows show the selected account’s exchange quantity, average entry and reported unrealized P/L. Long and short hedge legs have separate rows, size lanes and movement bands. Click the P/L cell to cycle base currency, quote currency and reported percentage; a dash means that value is unavailable. Values in different currencies are never added or converted implicitly.
Historical execution levels appear only when the shared accounting inventory agrees with exchange quantity and entry. Otherwise the ladder shows the exchange aggregate at its average entry, including positions opened before this terminal session. Working orders are displayed separately and never counted as filled inventory. Partial closes, external fills and reconnect snapshots update the same account model, including while the panel is hidden.
The movement band runs from entry to best bid for a long or best ask for a short. It shows price movement, not a fee-adjusted liquidation value. Session P/L is realized P/L including known execution fees from the terminal session boundary, using the shared execution ledger. Funding and other account adjustments are not included. Incomplete history or fee currency prevents a complete session result.
Ladder, hotkey and sidebar actions share quantity settings, order parameters, confirmations and account checks. The hedge selector sets order instructions; it does not switch the exchange account’s position mode. Existing positions and working orders constrain that selector. Close requests retain hedge-leg identity; flatten closes all legs in the selected account and market. Reversal requires one confirmed one-way position.
SmartDOM settings · DOMTrader: read and use the price ladder · Positions: inspect and close an open holding · Chart volume and depth tools