Work with data grids
Read a populated table, sort and filter rows, arrange columns, and export the result.
A data grid is the row-and-column view used by Positions, Orders, Trade History, accounting panels, and several market tools. Each row is one record; headings identify its fields. The example below contains simulated paper positions, including profitable and losing long positions and a short position.
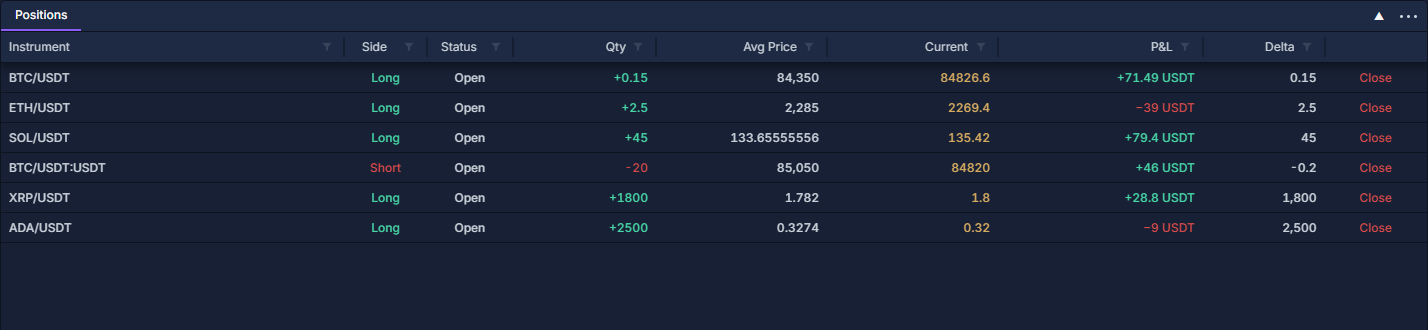
Read across one row before comparing rows: Instrument identifies the market, Side says Long or Short, Qty is the position amount, Avg Price is its average entry price, Current is the current quote, and P&L is the displayed profit or loss in its named currency. The Close button at the right is a trading action; it does not close the panel.
Sort a column
- Open PANELS → Positions or another populated table.
- Click the P&L heading. The small arrow beside the heading identifies the active sort direction. Click again to cycle the direction.
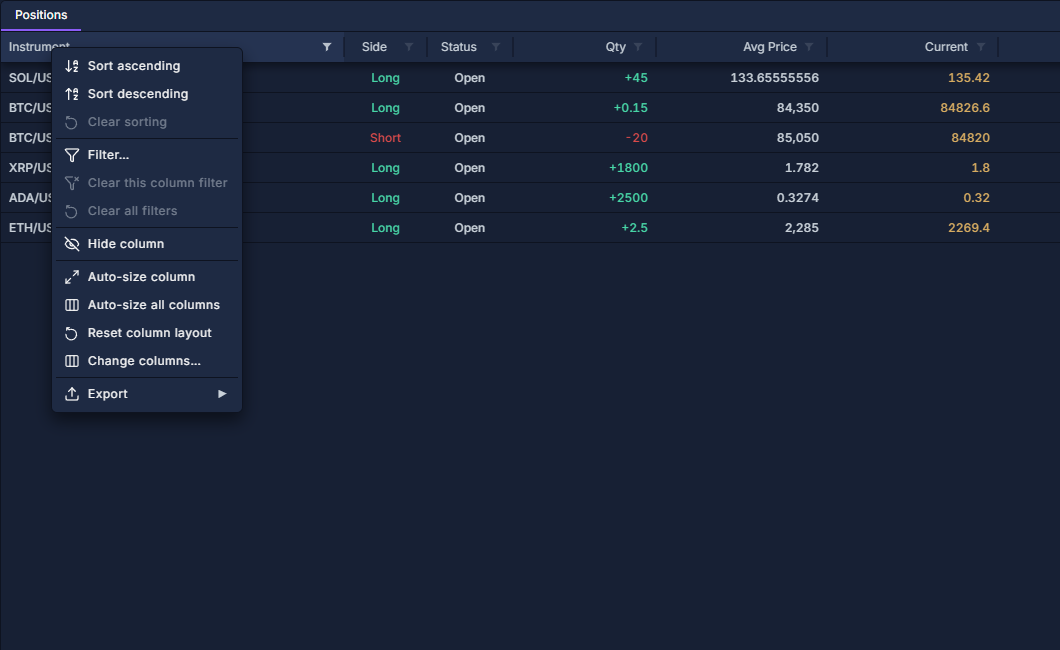
- To choose a direction explicitly, right-click the heading and select Sort ascending or Sort descending. Descending P&L puts the highest values first.
- Choose Clear sorting from that heading's menu to remove its sort.
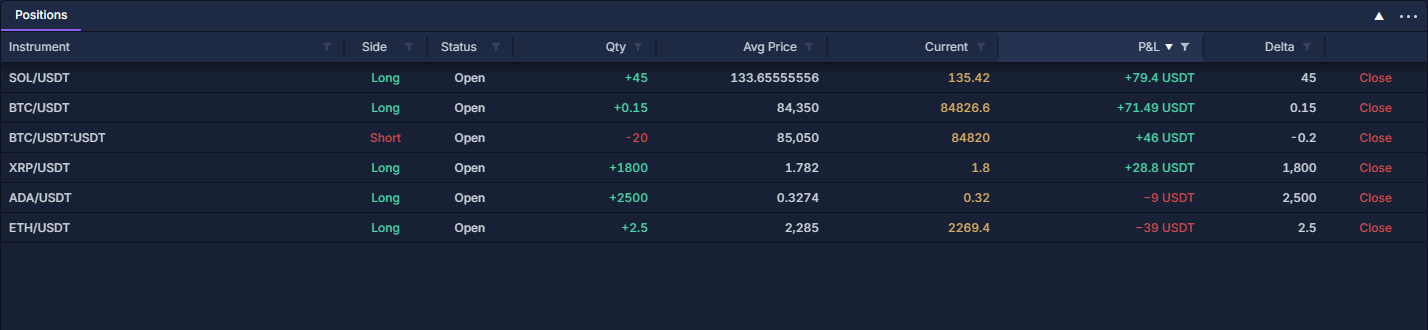
Sorting changes the row order, not the records or account. In a live market grid, updated values can move a row to another position in the sorted view.
Open the header menu
The header is the row containing names such as Instrument, Side, and P&L, immediately above the first data record. Right-click the column name, not the panel title and not a data row. The menu applies to that column. With the heading focused, Shift+F10 also opens it.
Filter values and numbers
Click the small funnel on the right of Side. In the value list, clear Select all, then select Long to show long positions only. Click outside to return to the table. Reopen the funnel to include Short again, or use Clear this column filter.
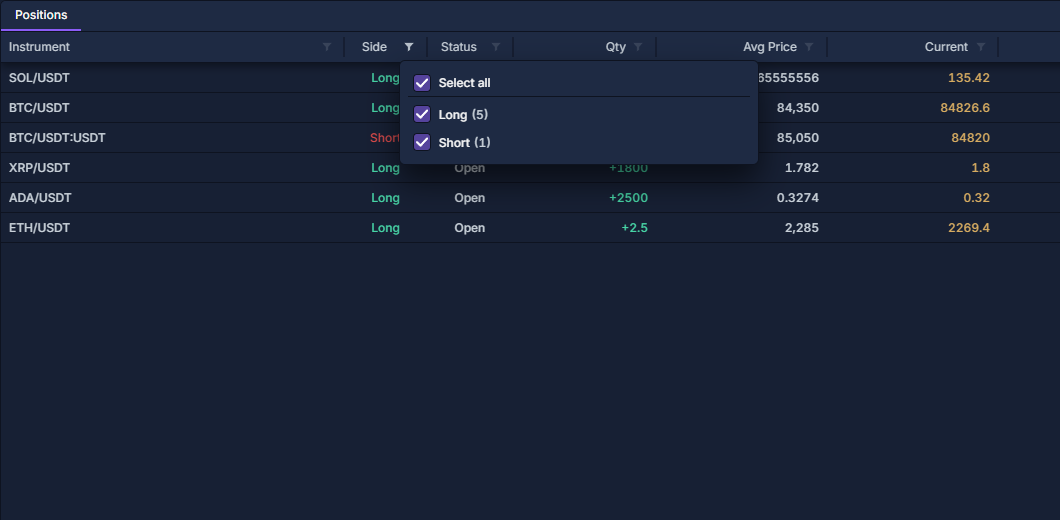
The search box inside a filter searches the available filter values. It does not search every field in the table. Numerical fields also have Compare: choose Equals, Does not equal, Greater than, Greater than or equal, Less than, Less than or equal, or Between, then enter the comparison value; Between needs two bounds. Date/time fields use Range. Values and comparison restrictions can work together.
For example, filter Side to Long and P&L to Greater than 0 to see profitable long positions. A row must pass every active column filter. If an expected record disappears, clear all filters before assuming the position or order is gone.
Arrange the columns
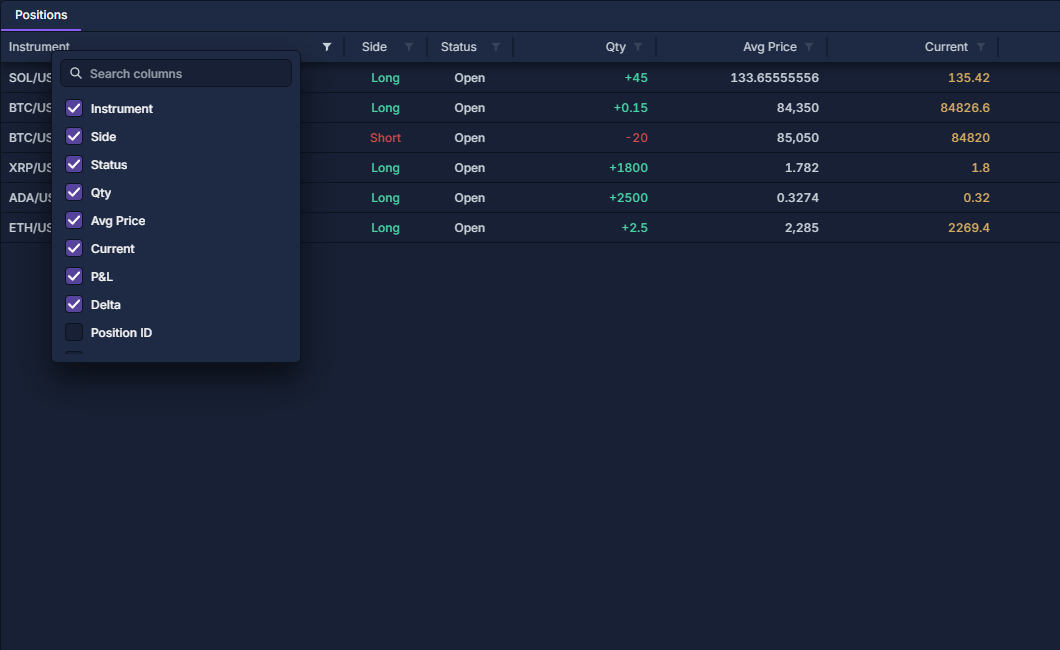
Drag a heading's divider to resize its column. Drag the heading itself to reorder it. Use Change columns…, search for a field such as Connection Name, and tick its checkbox to display it. Untick fields you do not need. Scroll horizontally when all selected columns do not fit.
Export a useful view
Set the desired filters and columns first. Right-click a heading, point to Export, and choose Excel workbook, CSV file, JSON file, PDF document, or Copy CSV, where offered. The account grids export the filtered records and visible exportable columns, including matching rows beyond the currently visible screen. Exporting does not submit, cancel, or close anything.
A dash means a value is unavailable, not zero. Keep quantity units, price currency, P&L currency, and percentage columns distinct. See Positions: inspect and close an open holding, Orders: quantities, status and cancellation, and Trade History: executions and fees for the meaning of each panel's records and actions.