Your first workspace
Open a chart, choose an instrument, and add the tools you need.
A workspace is a tab containing panels. Start with a chart and one complementary market view; add more tools as you need them.
Open a chart
- Click + beside the workspace tabs, then choose Empty. The plus opens a layout picker; selecting a layout creates the tab.
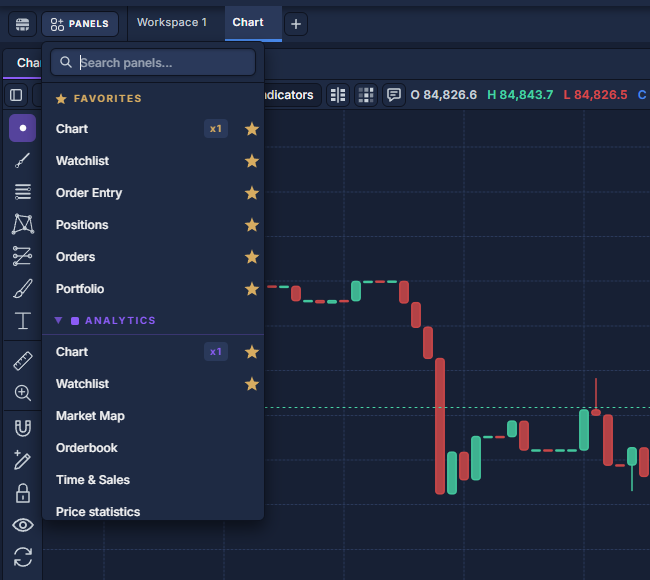
- Click PANELS at the left of the workspace-tab row, search for Chart, and click its row.
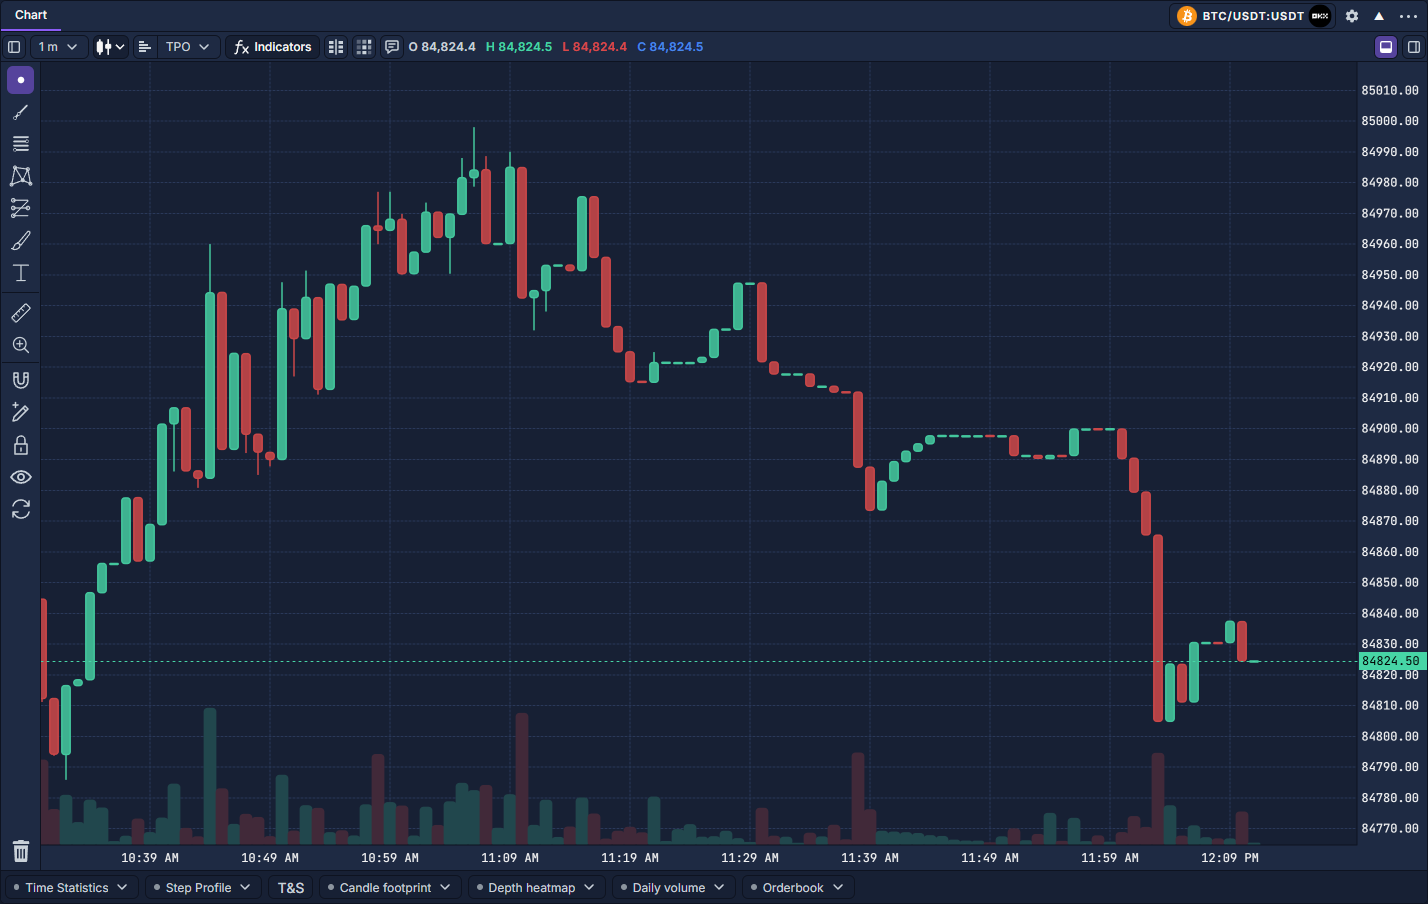
- Click the instrument in the chart header. Search for your market, check the provider and product type, then select the result.
- Click the timeframe button in the chart toolbar and choose a period, such as 15m.
Add a related view
Open PANELS → Time & Sales. Drag its title strip onto a docking target beside the chart, then release. Drag the divider to make both panels readable.
Right-click each panel's title strip and choose the same color under Link by symbol. Changing the instrument in one linked panel updates the group. Select and link instruments shows the selector and linking controls.
Right-click the workspace tab to Rename it or Export layout… for a portable copy. Workspaces and layouts explains restoration. Before preparing an order, review Connect a provider and Paper trading: practice a cash-account workflow.