Realized Volatility
Compare how much instruments have moved over different observation windows.
Realized Volatility measures how much prices have moved using historical candles. It helps compare recent movement with a market's longer history, or compare the percentage variability of several instruments. It does not show implied volatility from option prices.
Set up one instrument
- Open PANELS → Realized Volatility and select Single at upper left.
- Select the provider-specific instrument.
- Choose Daily or Intraday sampling. Intraday offers 1, 2, 5, 15 and 30 minutes, 1 hour and 4 hours.
- Choose the history depth: the presets are 300, 750, 1,500 and 2,000 observations; a custom request can be 90–2,000.
- Choose a Window of 5, 10, 21 or 63 observations, or enter a custom value within the loaded sample.
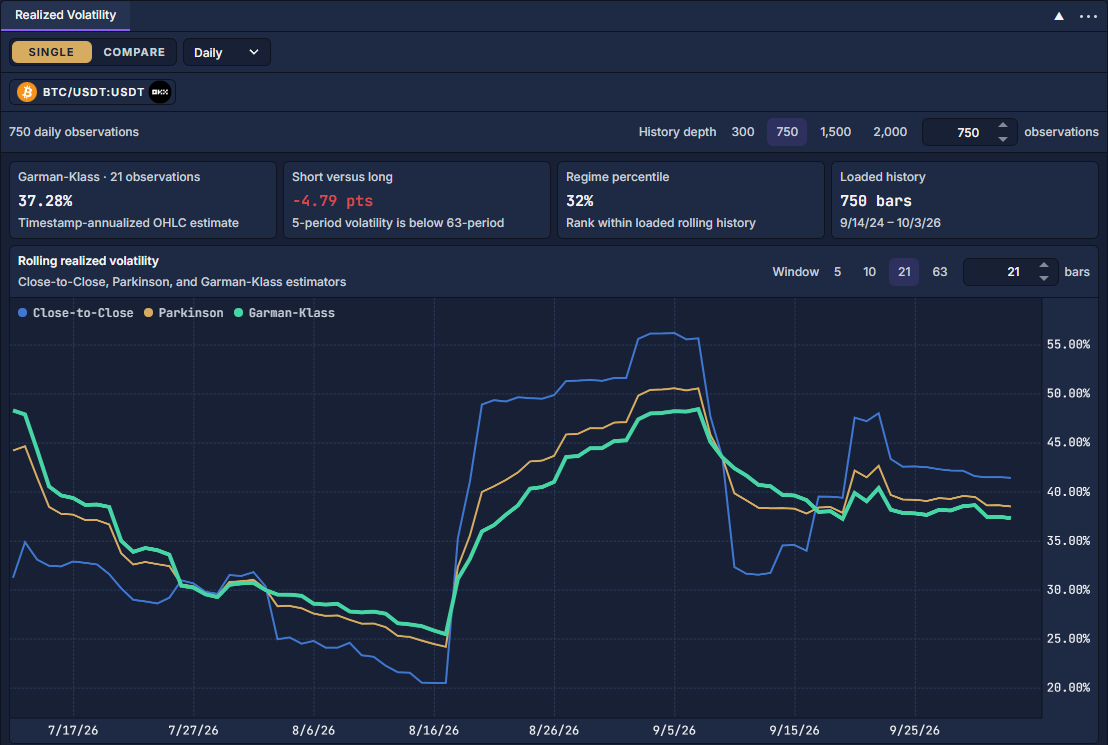
A window counts candles, not calendar days. A 21-window calculation on 5-minute data and a 21-window daily calculation describe different periods. History controls the sample requested; Window controls how many observations enter each rolling estimate.
Read the results
The current estimate uses Garman–Klass, which combines the candle's open, high, low and close. The chart also shows Close-to-Close, based on closing-price returns, and Parkinson, based on high/low ranges. Their assumptions differ, so the lines need not agree.
The matrix below the chart compares the estimator values across observation windows. Start with 21, then compare 5 and 63 to see whether the shorter sample is more or less variable. Insufficient history leaves affected values unavailable. Annualization follows the elapsed candle timestamps.
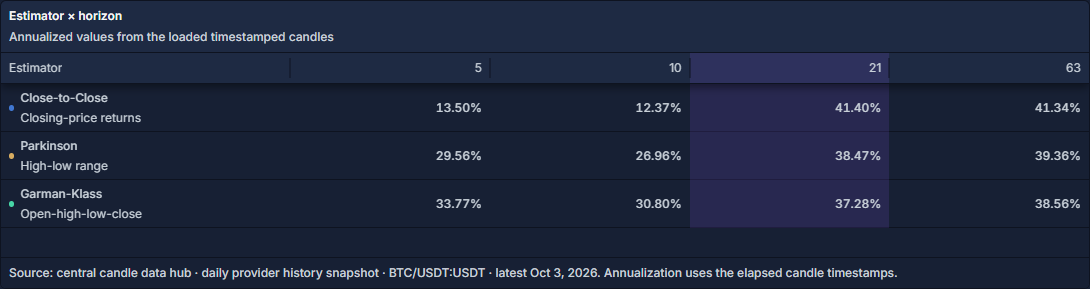
The estimator matrix compares 5, 10, 21 and 63 observations; scroll below the chart to reach it.
Compare instruments
Select Compare, use its symbol picker to add up to six listings, and keep the sampling and window consistent. The chart compares their Garman–Klass percentage curves over the overlapping available date range. Remove a selection to simplify the view.
Pan or zoom the chart to inspect a period. A higher realized-volatility curve means greater measured variability under those settings; it does not identify the direction of the next price move.
Select and link instruments · Chart: navigation, controls and settings