TPO: reading and working with a profile
Understand time at price, enable TPO, and split or merge profiles.
A Time Price Opportunity (TPO) profile shows which price rows the market visited during successive time brackets. With 30-minute brackets, one letter represents one bracket. A letter appears in each row touched during that bracket. Repeated trades at the same price inside that bracket do not add more TPOs to that row.
A wide row therefore means that more brackets visited that price. It does not mean more contracts traded there. Use the companion volume profile when you want executed volume at price.
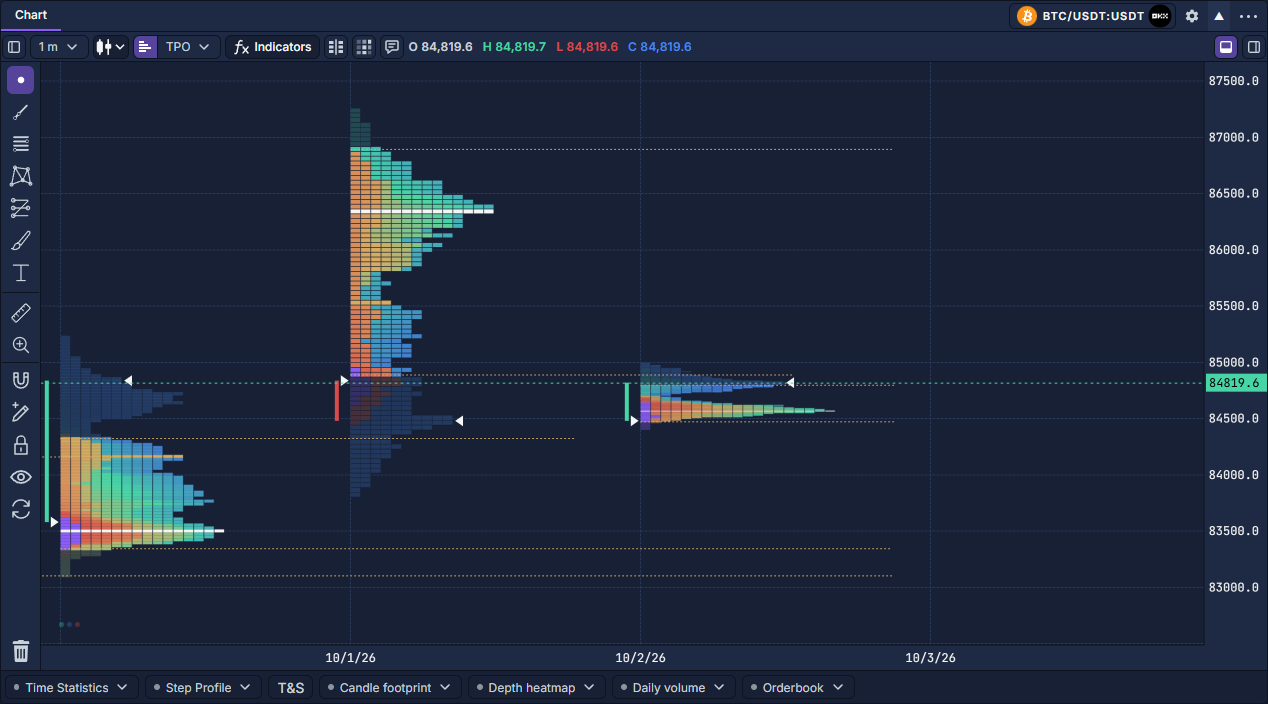
Find the controls and enable TPO
- Click PANELS → Chart and choose the instrument in the chart header. The illustrated opening controls are in Add and organize panels and Select and link instruments.
- Find TPO in the chart's upper toolbar, beside the price-series controls. It is a split control: the small icon switches TPO on or off; the TPO label and arrow open its settings.
- Click the icon to show the profiles. Opening the settings alone does not enable them.
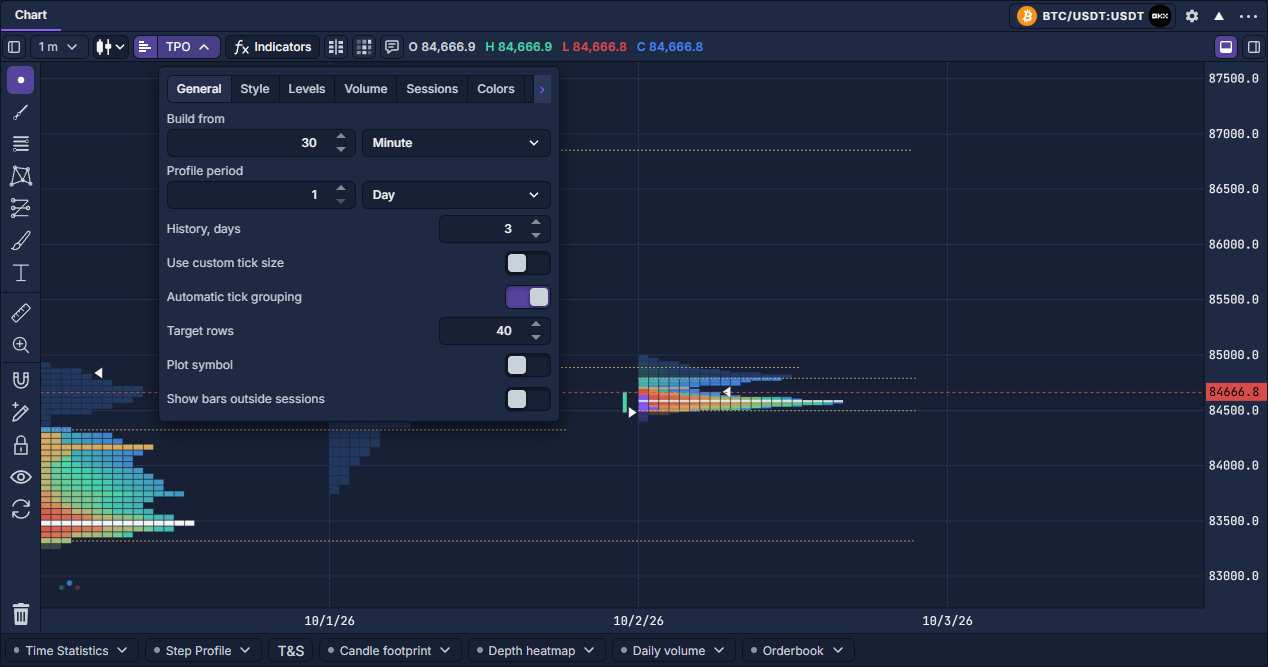
- Open TPO → General. As a starting example, choose Build from: 30 minutes, a 1-day profile period and 3 history days. These define three separate things: the letter interval, the profile interval and the amount of history.
- Use automatic price grouping initially. Adjust Target rows if the profile is too coarse or too dense. Give the chart enough height and width for its rows and letters.
- Open Style to choose Boxes or Letters. Close the settings by clicking outside them.
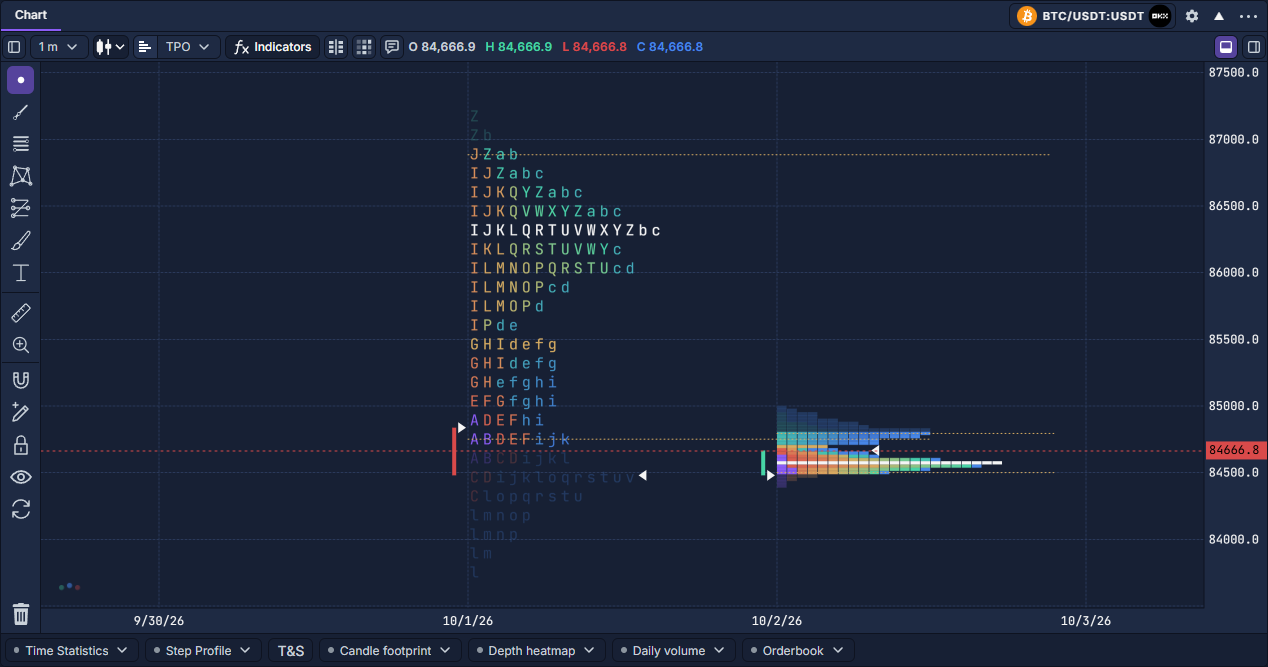
Read the profile
The profile is built from the available price history. Gaps in history are not evidence that no trading occurred. Delta, trade count and volume views additionally need the corresponding execution data.
Inspect time progression
A packed profile places occupied brackets side by side at each price. That makes its distribution easy to compare, but horizontal position inside a packed row is not a continuous time axis.
- Click inside a profile to select it. A selection outline and controls appear along its lower edge.
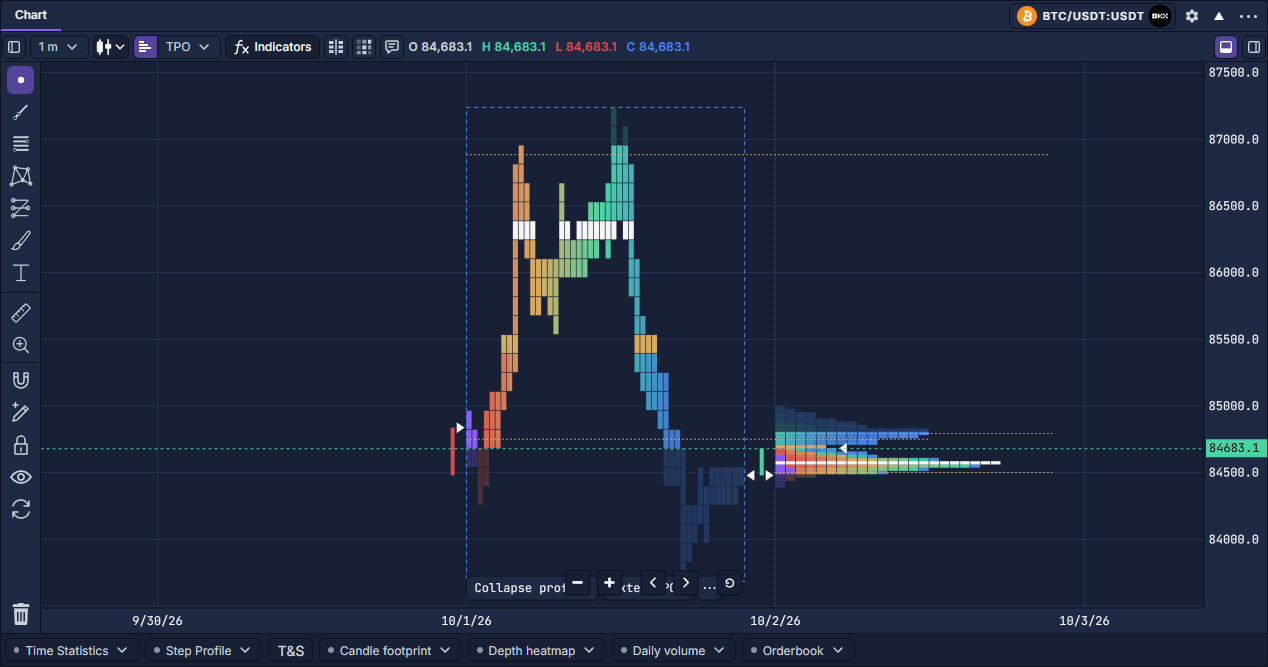
- Click the split control, or right-click the profile and choose Split profile. Brackets now occupy their chronological columns.
- Compare how the range develops from the early brackets to the later ones. Use Collapse profile to return to the packed distribution.
- Click outside all profiles to clear the selection.
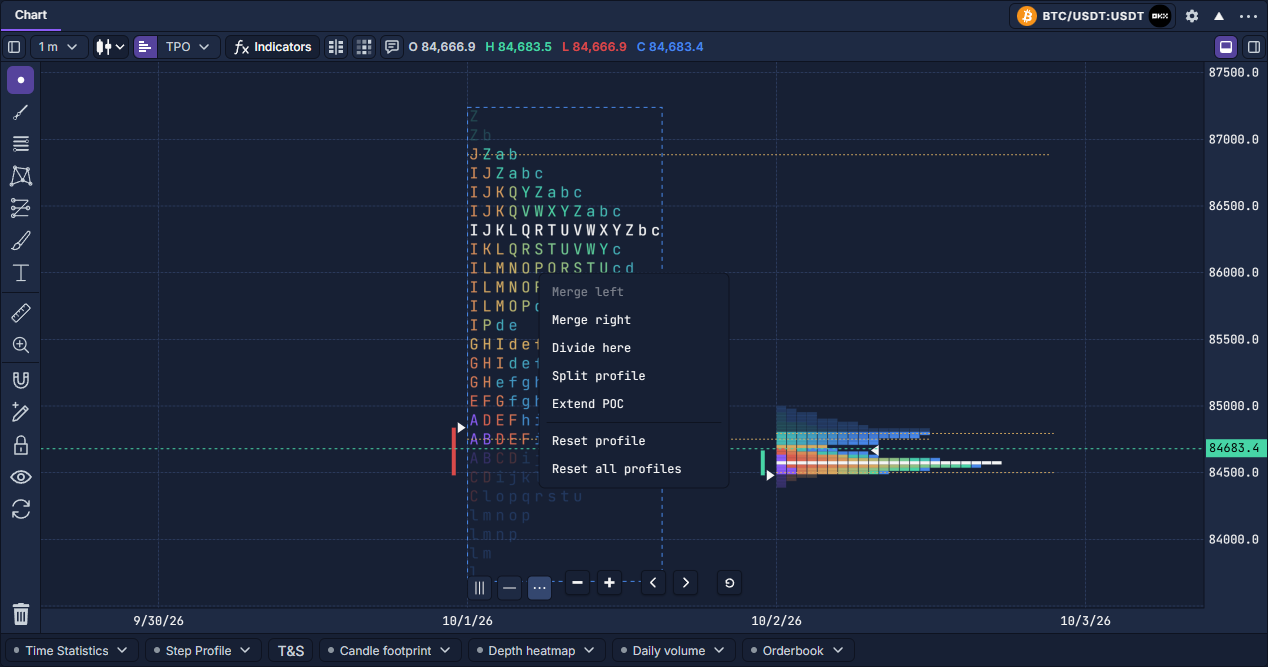
Divide, merge and extend a level
Divide here creates two profiles at a specific bracket. Select a letter or a chronological column in an expanded profile, then open its context menu. The action is unavailable when the pointer does not identify a bracket.
Merge left and Merge right combine the selected profile with its neighbor. Counts and levels are recalculated for the combined distribution. This lets you compare a multi-session balance with its separate daily profiles. Reset profile restores that composition; Reset all profiles clears the profile composition changes across the chart.
Extend POC toggles the selected profile's POC ray. It is independent of the general POC extension setting. Use the lower-edge control or the profile menu to change it.
Before comparing profiles, keep the instrument, bracket interval, row step and session definition consistent. TPO settings explains all seven settings tabs, and TPO sessions and templates walks through session templates.