Orderbook
Read bid and ask depth and adjust the displayed quantity unit.
Orderbook shows the current resting buy and sell interest for a listing. Its ladder gives quantities at individual prices; the depth plot adds quantities cumulatively as prices move away from the best quotes.
- Open PANELS → Orderbook.
- Click the instrument in the panel header to choose a listing.
- Resize the panel until its price and size labels fit.
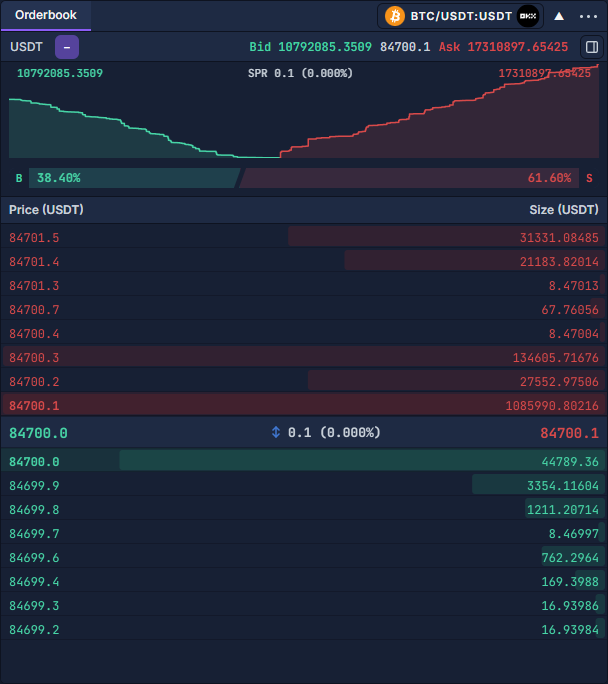
Read the book
Red asks sit above the spread and green bids below it. The best ask is the lowest displayed selling price; the best bid is the highest buying price. Their difference is the spread. The percentage shown with it is relative to the best bid.
Each horizontal row bar represents the quantity at that price. The upper depth plot is cumulative, so it answers a different question: how much resting quantity is available as you move through successive prices?
The toolbar's Bid and Ask figures total the currently available book on each side. The number between them is the midpoint of the best bid and best ask. The B/S percentage bar compares the two side totals. Those totals cover the available book data, not just the rows that fit on screen.
Change the view
Small sizes can require more Display → Decimal Places in application Application settings. There is no separate Orderbook settings dialog to configure these controls.
Inspect a price or prepare an order
Clicking a price level opens order preparation with that level's price and side. It does not submit an order. Check the account, quantity, unit and order type in the ticket before proceeding; see Order Entry: prepare and review a ticket.
Book quantities can change or disappear before an execution. Compare them with Time & Sales to see reported trades. For a ladder with additional trading and analysis controls, use DOMTrader: read and use the price ladder.