SmartDOM settings
Configure pane geometry, readable quantities, footprint metrics, heatmap and trading presets.
Click the gear beside the instrument in SmartDOM’s panel header. The dialog is titled Orderbook Settings and has Trading, General, Appearance, Footprint, Heatmap and Hotkeys tabs. Use the search field to find a setting; clear it to restore all controls. Changes apply to this panel.
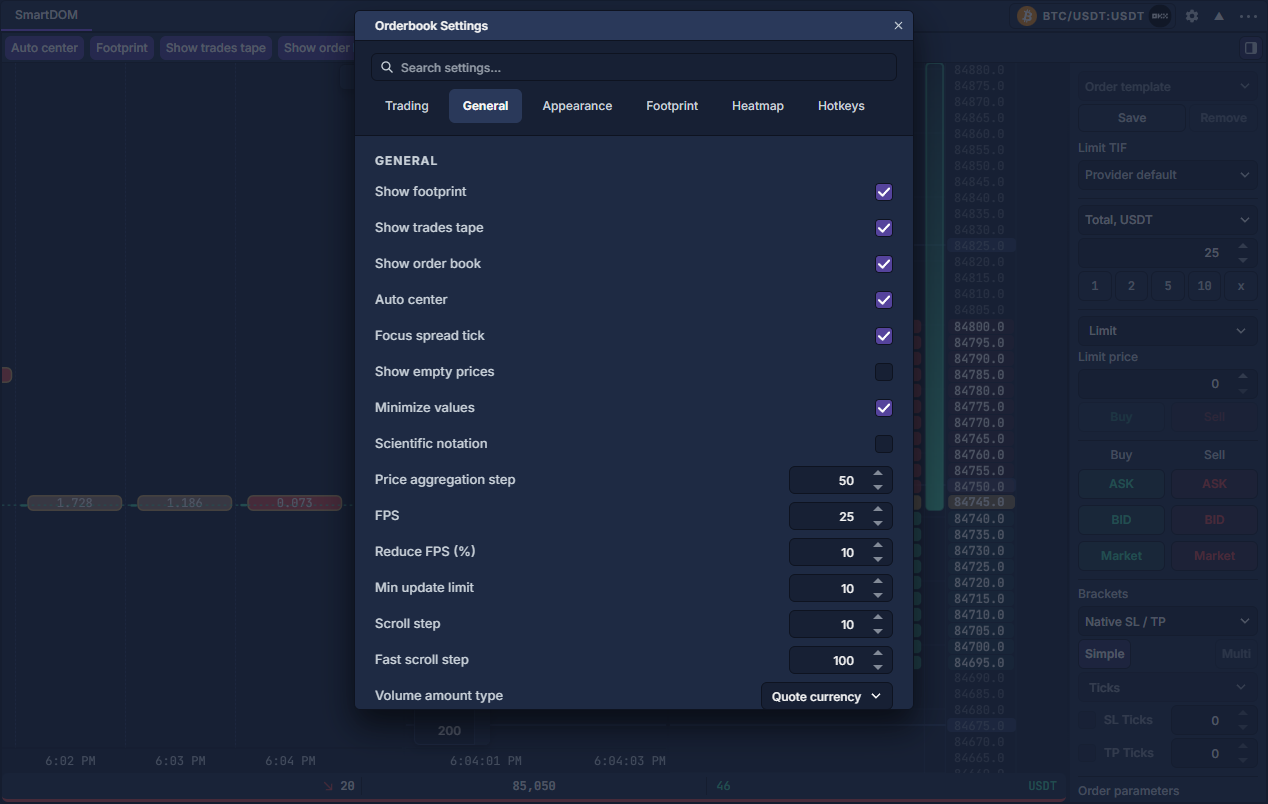
General: arrange the view
Controls whose current behavior is fixed
The present view always draws empty price rows, trade bubbles and their line, and uses automatic book-size scaling. The General fields Show empty prices, Show trades, Show trades line, Hide trades less, Hide values less quote, Auto calc orderbook max, Orderbook max volume base/quote do not currently override that behavior. Focus mode → Off hides the hover overlay; its other modes use the same combined overlay, with the ruler in points.
Use the pane toolbar switches to hide an entire view. This distinction matters when a saved setting appears to have no effect.
Appearance: make size and positions readable
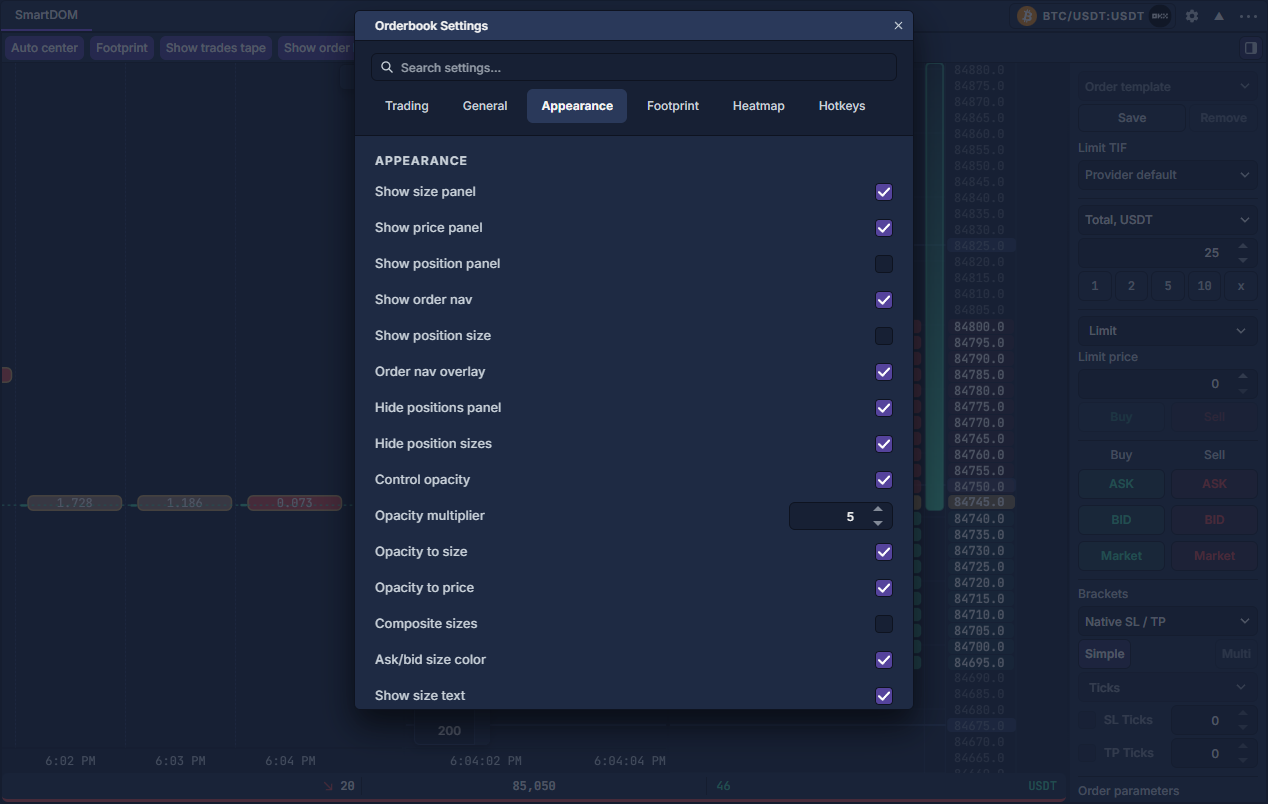
Show size panel / price panel / position panel / order nav / position size control the corresponding display areas. Order nav overlay places navigation over the view. Hide positions panel / Hide position sizes suppress those position displays. Max position size panel width limits the width allocated to position size.
Control opacity scales emphasis with quantity; Opacity multiplier strengthens it. Opacity to size / price also dims the corresponding text. Keep text legible when comparing small levels. Composite sizes combines bid and ask information in a grouped row; Ask/bid size color, Draw ask/bid background and Show size text choose coloring and labels. Show accumulated orders adds cumulative depth.
Size bar direction and Size text alignment control left/right alignment.
Footprint: select what each cell means
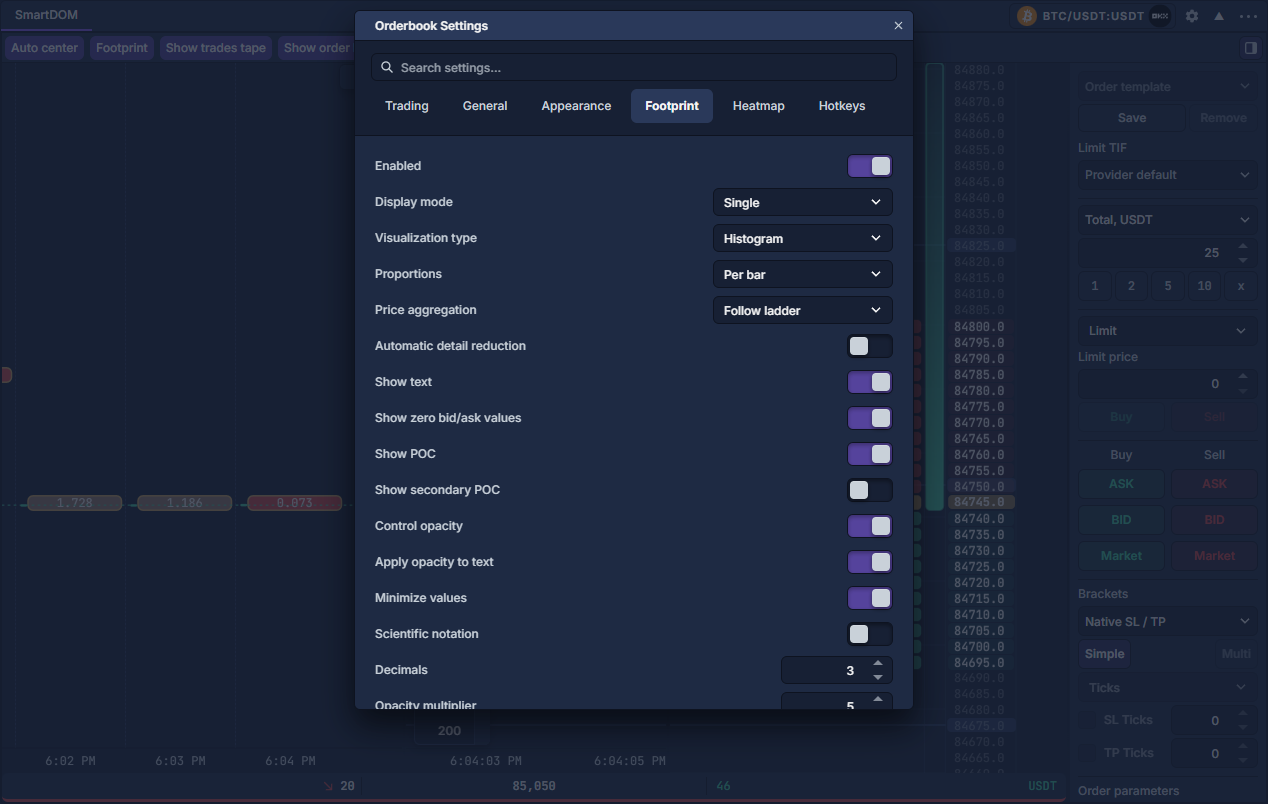
- Enable Footprint in the toolbar and Enabled in this tab. Choose Single for one metric area or Double for two. Histogram uses bars; Cluster uses cells.
- Choose Follow ladder to align price grouping with the ladder, or Fixed → Ticks per row for independent footprint aggregation. This does not change ladder geometry.
- Set each side’s Data type: total volume, trade count, average size, or the corresponding buy/sell measure. Coloring source selects the quantity or delta that drives the color. Text display selects Value, Delta, Sum or Both. Read those choices together before interpreting a number.
- Choose proportions Per bar, Visible range, Loaded chart or Custom. Per bar emphasizes the strongest level in each bar; a common scale supports comparison between bars. Custom requires a positive scale maximum for the side.
- Use Show text, zero-value visibility, POC and secondary POC, decimals, abbreviation, opacity and text-opacity controls for readability. Automatic detail reduction can reduce detail when cells become too small; turn it off only when the available space supports the detail.
Heatmap: history and interpretation
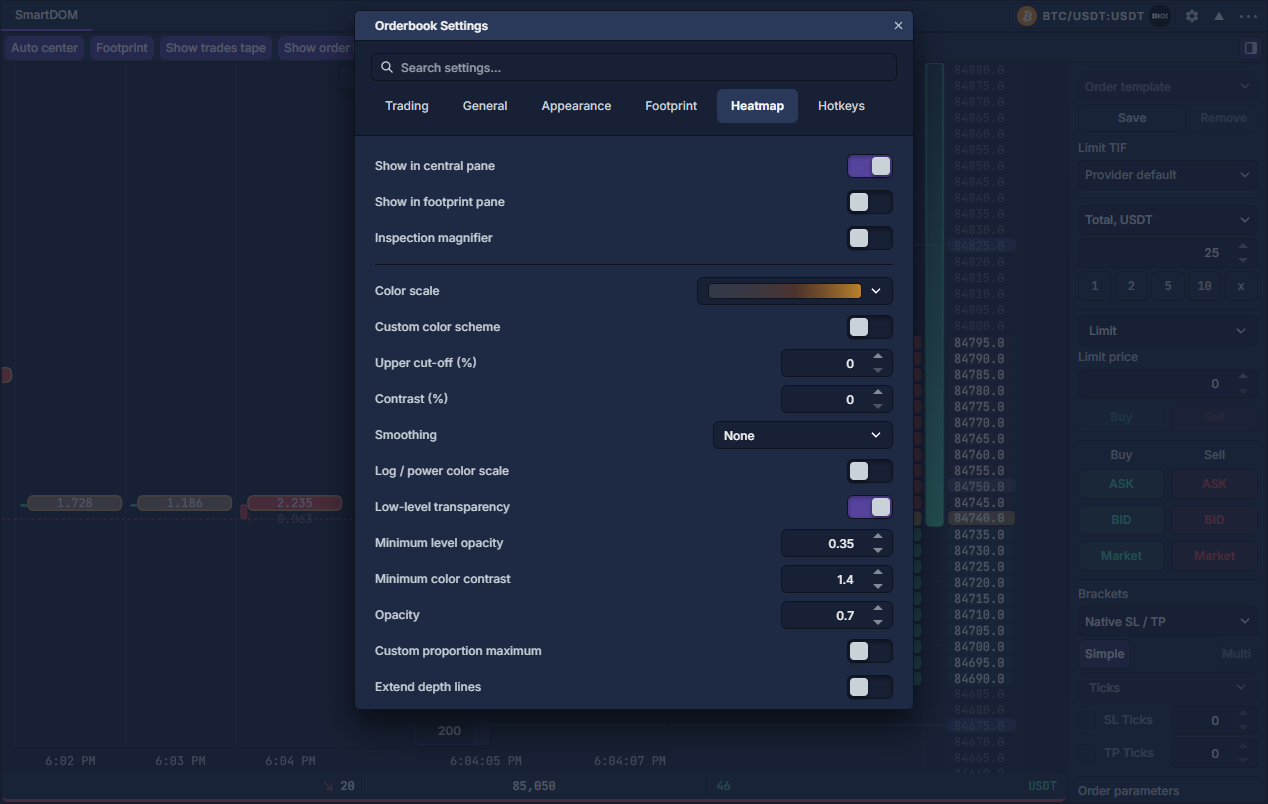
Select Heatmap, or right-click the central tape and use the gear beside Show depth heatmap. Start with the time basis and interval, then choose Latest or Maximum. Latest is the final observed book in a column; Maximum combines each level’s peak and does not represent one simultaneous book.
Set the displayed depth limit after price grouping, quantity filtering, palette, contrast and opacity. Best-price lines show the current book. Last-limit carry/extension projects the last observation visually; it does not confirm those orders remain. Minimum level opacity preserves small quantities, while minimum color contrast separates the coldest colors from the background; 1 keeps the unadjusted palette.
Changing market or sampling interval starts new history. A depth-limit change preserves retained history. Older columns can become coarser to stay within memory limits. Preferences persist, but this view does not save depth to disk; a retention-days field is not an active durable archive. Sound thresholds use global sound preferences.
Trading and Hotkeys
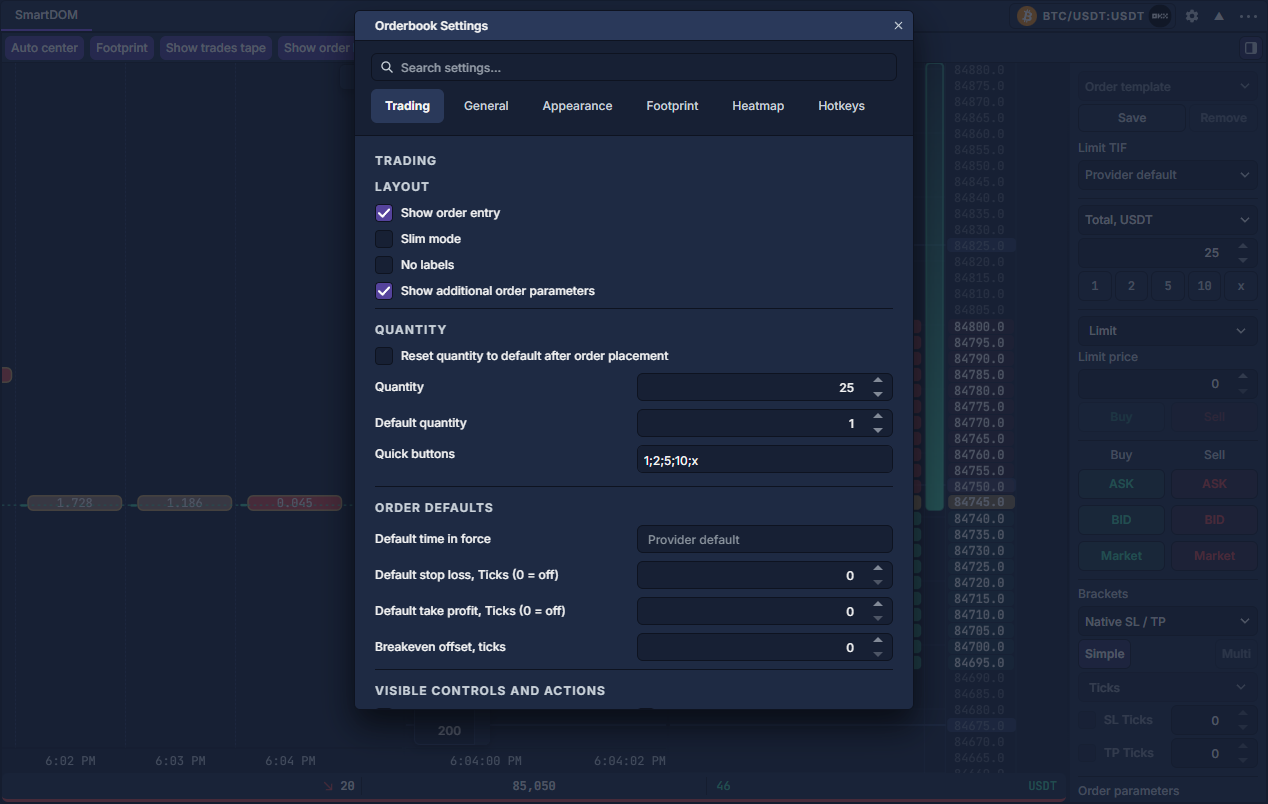
The Trading tab contains the shared Order Entry: prepare and review a ticket settings and five Base / Quote amount presets. Amount type chooses which preset unit is active. Buy trigger / Sell trigger choose Market or Limit for the resulting trigger action. Review brackets, flags, confirmations and account support before using a ladder gesture. Hotkeys lists the current panel bindings; Keyboard controls explains how the application’s keyboard-trading gate applies.
A practical layout
- Show all three panes and activate Auto center. Start with an aggregation that gives a useful range around the spread.
- Give the footprint enough width for several readable bars; choose a 1-minute duration and Follow ladder. Select a single volume or delta view before trying two metrics.
- Keep size text visible, use automatic book scaling and moderate opacity, then watch how a trade bubble differs from an unchanged depth patch.
- Open the sidebar, review the order unit and keep the simulated account separate from a live trading connection. Save the panel layout through Reuse panel settings.
SmartDOM: footprint, tape and depth · Chart volume and depth tools · Order Entry: prepare and review a ticket