Time & Sales
Follow executions by side, price, size, and time.
Time & Sales shows reported market executions for the instrument selected in its header. Use it to see where trading is actually occurring, then compare those executions with the resting interest in Orderbook. Your own account fills are in Trade History: executions and fees.
Open and read the tape
Open PANELS → Time & Sales, then click the symbol at the right of the panel header to select the provider-specific listing. Keep Time sorted newest first to follow incoming executions.
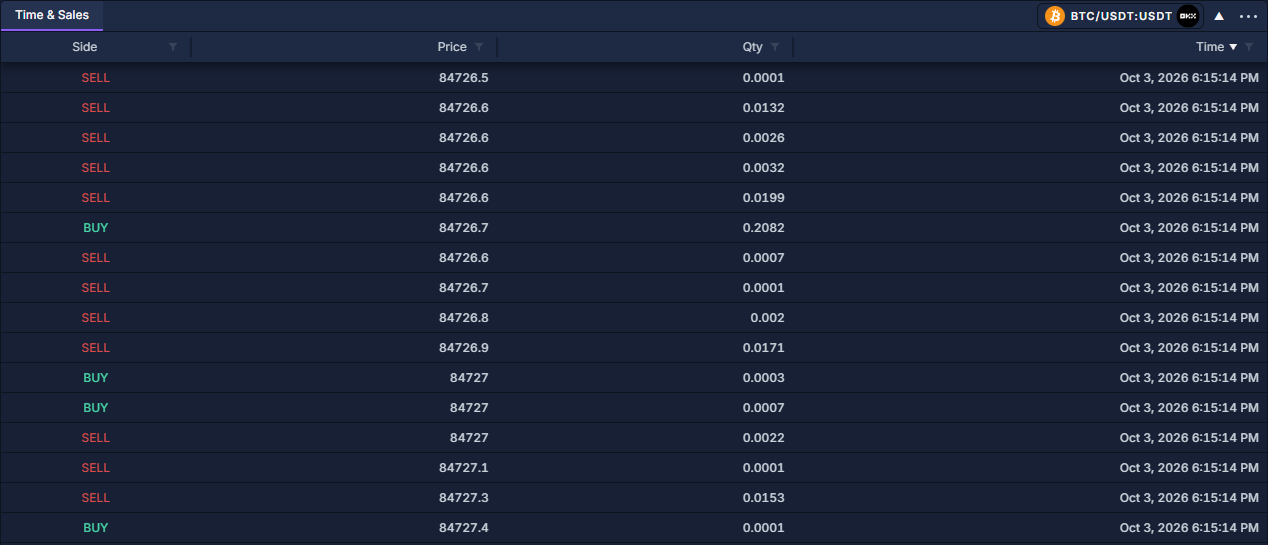
The screenshot uses six decimal places so small BTC quantities remain readable. If sizes appear as zero, open the application gear, choose Display → Decimal Places, and increase the precision; the display may be rounding a small nonzero quantity. See Application settings for the gear's location.
Find larger executions
- Click the funnel beside Qty in the column header.
- Choose a greater-than comparison and enter a size relevant to this instrument, then apply it. For example, 0.01 on a BTC quantity field focuses on records larger than 0.01 BTC.
- Add a Side filter if you want to inspect one reported aggressor side.
- Clear the filters when returning to the full retained tape.
Sorting by Qty brings large records together but changes the chronological sequence. Restore Time descending to follow the market again. Work with data grids explains sorting, filtering, column layout and exporting the loaded table.
The panel combines available recent history with incoming executions and retains a bounded recent tape. It is not an unlimited historical archive. Provider aggregation can also affect how executions are represented; one displayed record is not always one individual fill.
Use Price statistics when you want these executions grouped by price instead of listed in time order.