TPO volume profiles
Compare time at price with executed volume and configure per-period and edge profiles.
TPO counts time brackets at price. A volume profile instead groups executions into price rows. A price can have many TPOs but little volume, or few TPOs and a large executed quantity. Keep the two POCs distinct when comparing them.
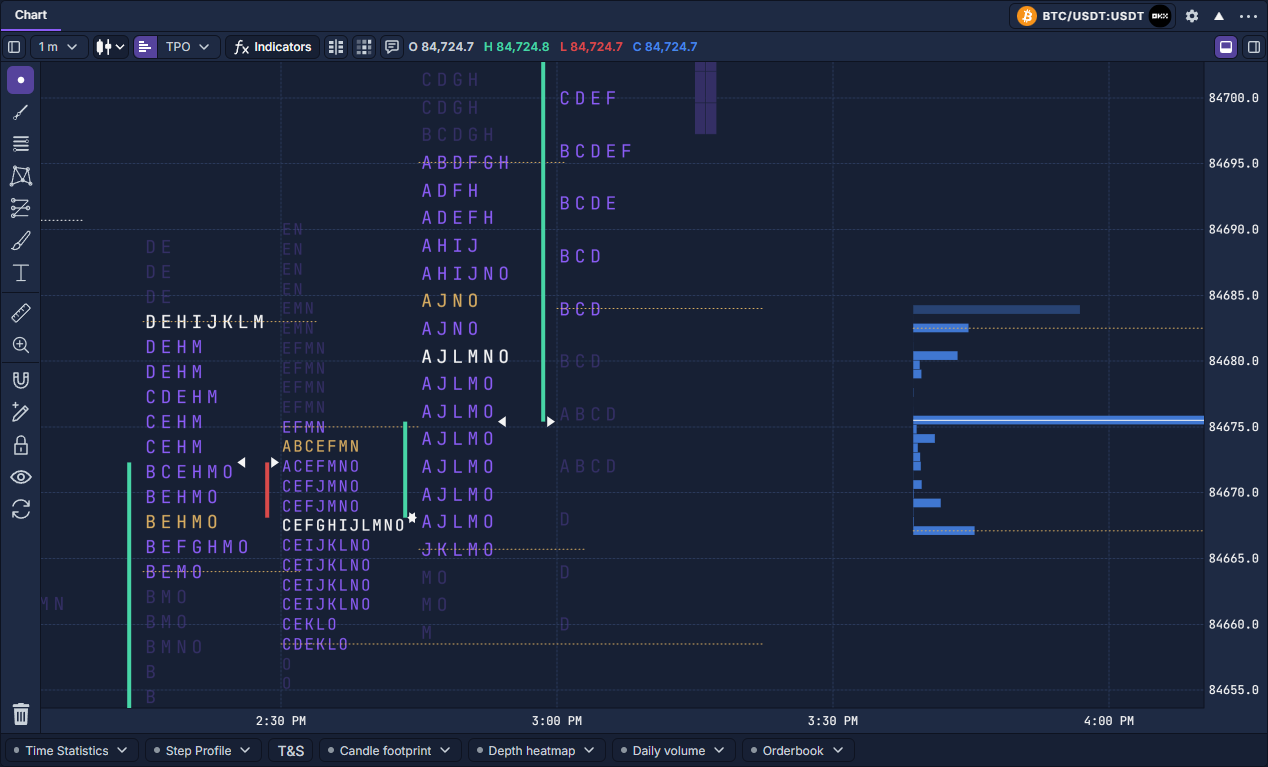
The blue histogram at the right covers a closed one-minute custom interval, 21:42–21:43 UTC. Bar length represents executed volume at each price. The white horizontal level marks its volume POC and the dotted boundaries show its value area. The letter profiles to the left measure time, so their POCs need not coincide.
Drag the chart's right price axis to enlarge the vertical range of interest. This example deliberately zooms around the histogram; parts of the taller TPO profiles extend outside the visible price range. Use the axis's A control to return to automatic fitting.
The Volume tab contains three independently configured tools:
Add and read a histogram
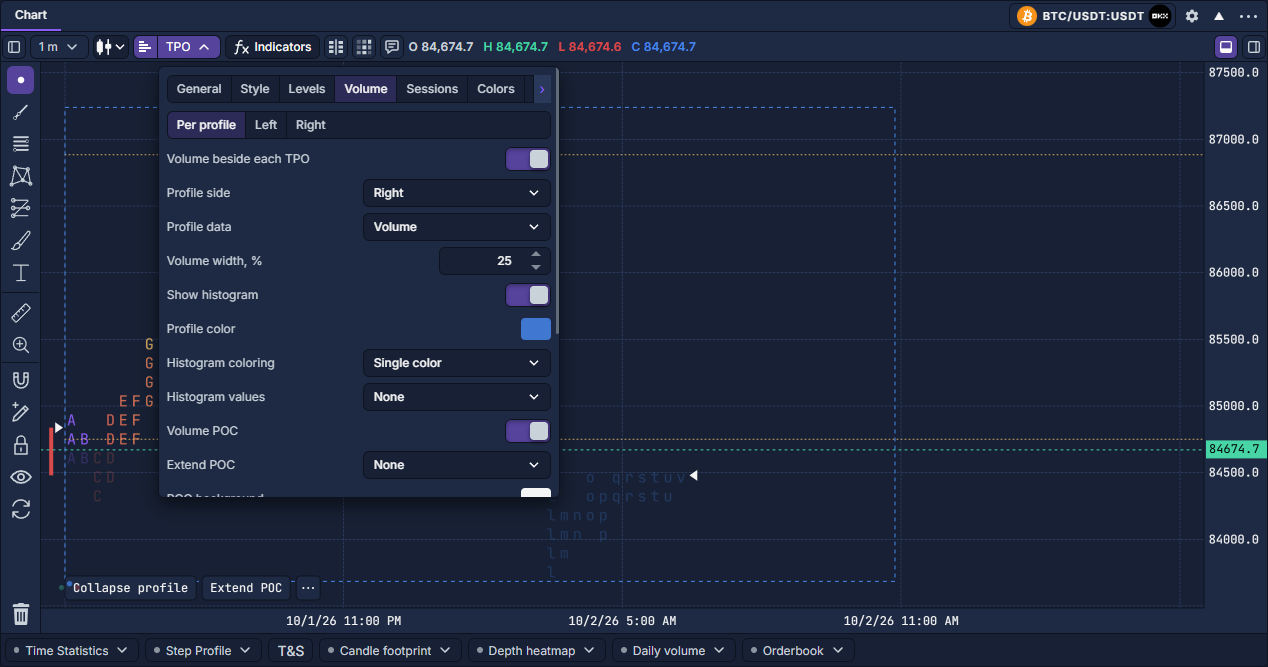
- Open TPO → Volume using the text-and-arrow control in the upper chart toolbar.
- Select Per profile, then enable Volume beside each TPO. Choose its left or right side.
- Set Profile data to Volume and enable Show histogram. Each bar's horizontal length now represents the executed quantity in that price row.
- Adjust Volume width, % to give the bars room. Use Histogram values to place numeric labels on the left or right, or hide them.
- Enable Volume POC and Volume value area to compare these levels with the time-based TPO levels. Their coverage and extension settings are independent.
- Wait for the execution history to load before interpreting the shape.
Choose what the bars measure
Volume, Buy volume and Sell volume measure executed quantities. Buy/sell volume presents both sides. Delta is buy minus sell quantity; Delta % and the buy/sell percentage metrics express relative shares.
Trades, Buy trades and Sell trades count the source records with the corresponding classification. Where the source supplies aggregated records, that count is not a count of individual exchange fills.
Average-size metrics divide the relevant quantity by its count. Maximum-size and filtered-volume metrics require the necessary execution detail. Filter size sets the trade-size threshold used by filtered total/share/buy/sell measures. Unavailable detail is not a measured zero.
Give an edge profile a separate interval
Choose Left or Right, enable that profile, and select Calculation range. Available choices include the visible range, 15 or 30 minutes, 1 hour, today/yesterday, current/previous week, month or session, full selected history, and a custom interval.
For Custom, enter both From and To. These custom range fields use UTC. The session-template time zone separately controls what counts as a session; it does not reinterpret the custom UTC fields.
Use Add range to compare another interval in the same edge tool. Each additional range has its own color and can be removed. Up to 16 additional ranges are available; overlapping ranges remain separate distributions.
Control appearance and levels
Histogram coloring can be single color, heatmap, delta, volume, trades or another data type. The coloring metric can differ from Profile data, which controls bar length. For example, volume can determine length while delta supplies color.
Label text/background, profile color and totals are separate choices. Show histogram, Volume POC, Volume value area and value-area borders can be controlled independently. Set the volume value-area percentage, POC and boundary colors, and their extensions without changing TPO coverage.
Start with one interval and one metric, then add the second profile for a deliberate comparison. If a profile remains blank, check the source's execution-history availability and the selected interval before changing the colors.
TPO: reading and working with a profile · TPO settings · TPO sessions and templates · Chart volume and depth tools