Add and manage indicators
Add a study, choose its inputs and appearance, and manage its chart pane.
Indicators calculate a series from the chart’s data. An overlay such as a moving average follows the price scale; an oscillator can occupy a separate pane. The example shows a 9-period Simple Moving Average of Close, with its name, inputs and current value in the legend.
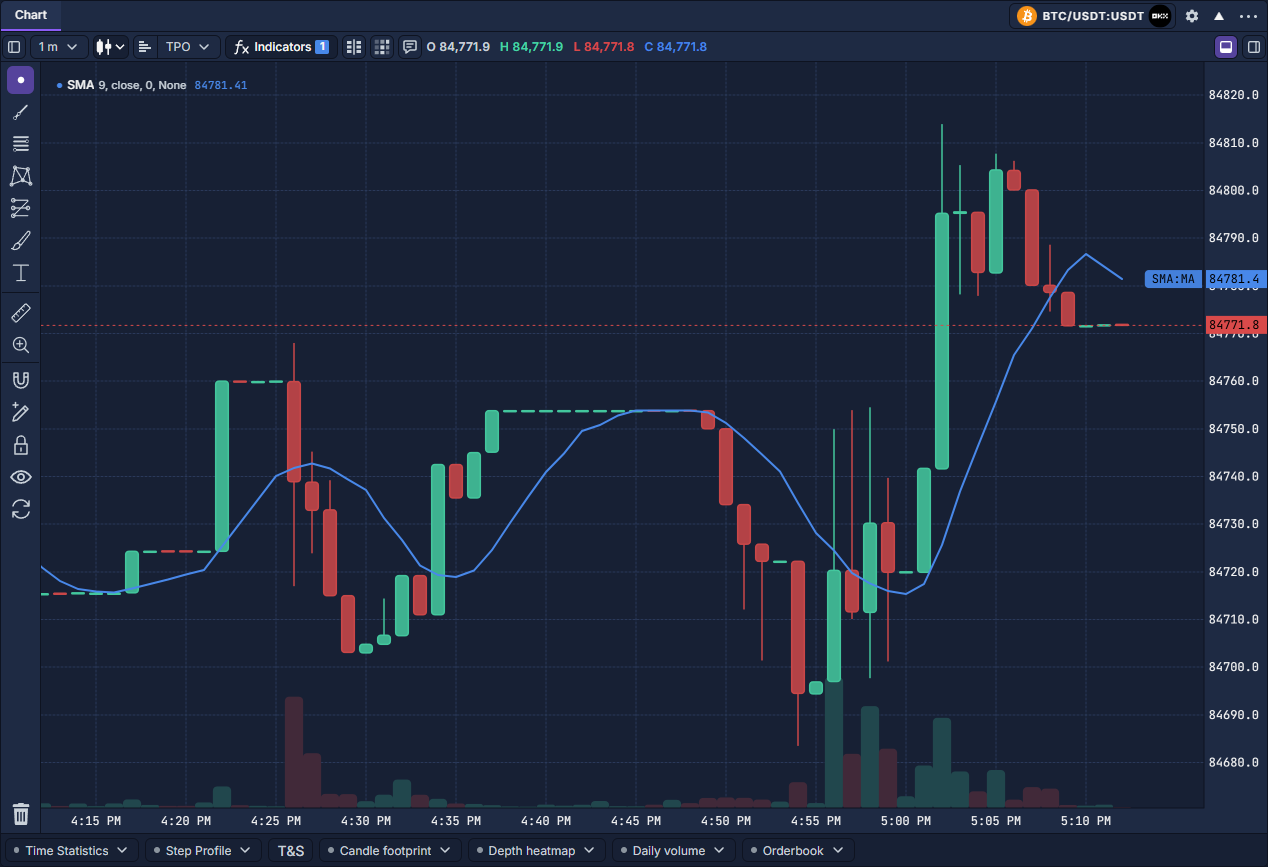
Add a study
- Click Indicators in the upper chart toolbar. Search by name or abbreviation, or choose a category at the left. The star beside a result adds it to Favorites.
- Select Simple Moving Average (SMA). In Inputs, choose Length and Source; here Length is 9 and Source is close. A length of 9 on a one-minute chart uses nine source observations.
- Use Style to choose plot colors and hide individual outputs where the indicator provides them. Click Add to Chart. Selecting a configurable study alone does not add it.
- Close the picker to inspect the line and legend. The Indicators badge counts added studies. Repeat the process to compare another study or another set of inputs.
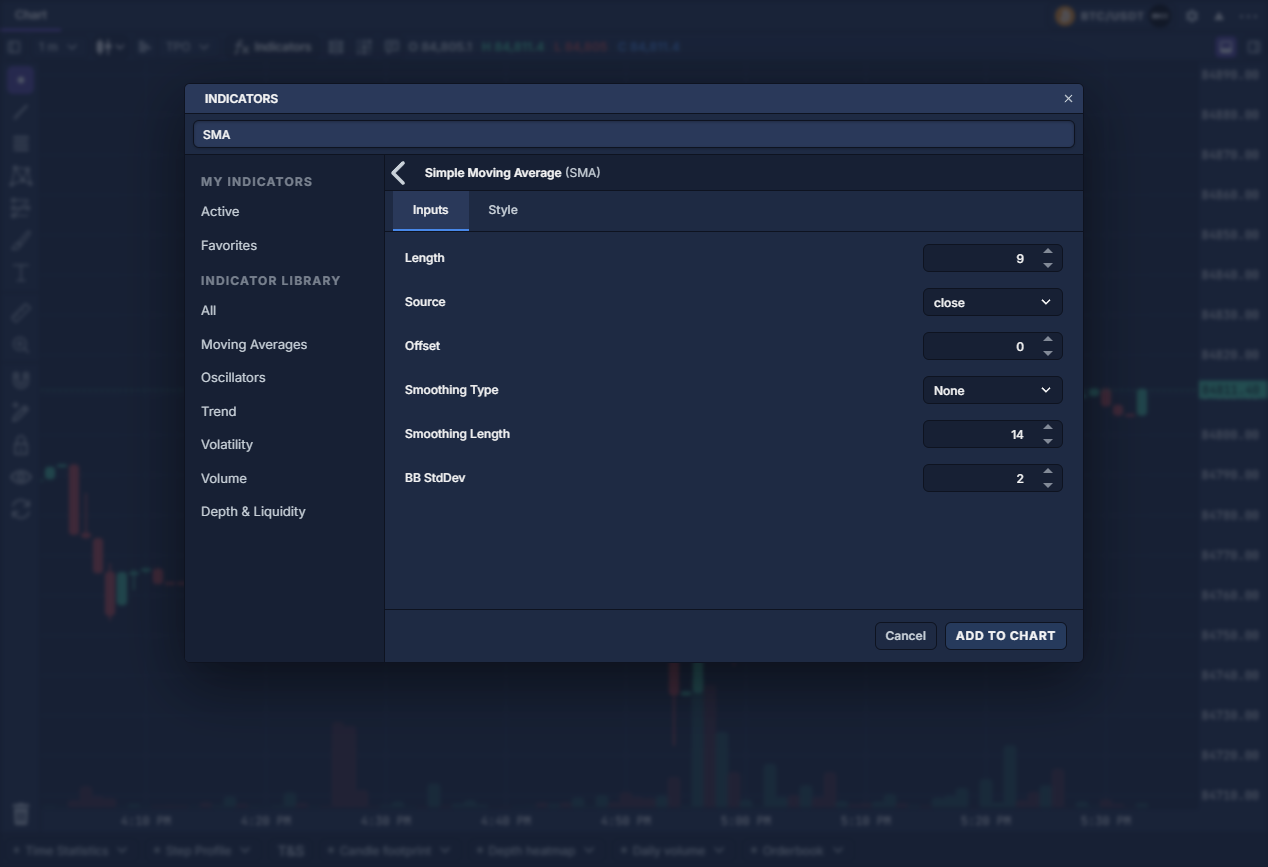
Read and adjust the result
The legend beside SMA shows the input summary and calculated value. A moving average smooths the selected source; a longer Length normally responds more slowly. Source chooses the input price or series. Offset shifts where the output is drawn; it does not create new observations. Optional smoothing and its parameters apply an additional smoothing method.
Hover the indicator’s legend inside the plot to reveal the eye, gear and three-dot controls. Click the gear or the indicator name to edit it, switch between Inputs and Style, then click Update. These controls belong to the study; the gear in the panel header opens general Chart Settings.
The eye hides the study while keeping its configuration. The legend’s three-dot menu offers Move to actions for the main chart, a new pane or an adjacent existing pane, plus removal. Put an oscillator in a separate pane when its units do not belong on the price scale; drag the pane separator to give it room.
Use the object tree
Click Object tree, the first upper-toolbar button. Expand Indicators, then use the row’s eye to hide/show or X to remove. Double-click a row to open its settings. Removal deletes that instance; hiding preserves it. The legend menu also offers Create alert for supported outputs. Alerts explains alert conditions, while Reuse panel settings covers saved panel setups. Changing timeframe changes the time represented by a period. Allow sufficient source history for a study’s initial calculation.