Drawing tools and objects
Draw a line, edit its anchors and style, and manage objects without losing them.
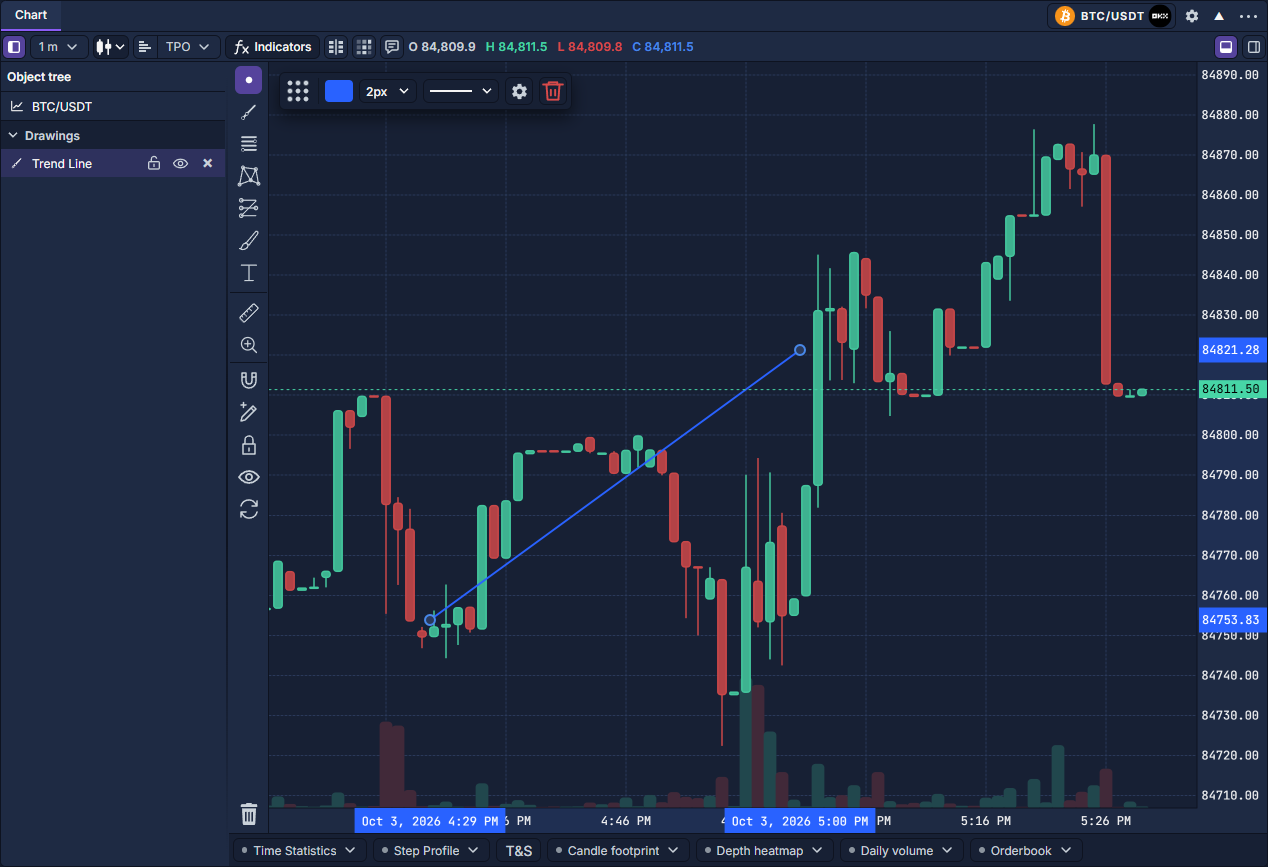
Drawings attach marks to chart times and prices. A trend line connects two anchors; a horizontal level marks one price. Fibonacci tools, patterns, ranges, shapes and text use the same selection and object-management controls. The example shows a selected trend line, its handles, its floating style bar and its Object tree row.
Draw and edit a trend line
- Find the diagonal-line button near the top of the left toolbar. Click it for Trend Line. The small adjacent category arrow opens related lines, channels and pitchforks. Other category arrows expose Fibonacci tools, patterns, measurements, shapes and annotations.
- Click the first chart point, move to the second point and click again. Press Escape to return to the cursor. Tools with additional anchors continue until those anchors are placed.
- Click the completed line to select it. Drag an endpoint handle to change an anchor; drag the line itself to move the whole object. Its selected price/time labels identify its anchors.
- Use the floating bar above the plot to change color, width and line style. Its gear opens the drawing’s full settings; its trash button removes the selected object.
Choose the right tool and controls
Use a horizontal line for a price level, a trend line or channel for a sloping range, and a rectangle for an area. Range/measurement tools compare price and time between anchors. Fibonacci and pattern tools depend on the anchors you place; changing an anchor changes their levels. Text and annotation tools add notes to a location.
The magnet snaps anchors to nearby candle price points; its arrow offers Off, Weak and Strong. Keep drawing keeps the chosen tool active for another object. Turn it off when returning to ordinary chart navigation.
The lock prevents accidental drawing changes. The eye hides drawings without deleting them; toggle it again to restore them. Synchronize drawings for this market, when available, shares drawing state for the same market. It is separate from a panel’s symbol-link group.
Manage objects in the tree
Click Object tree, the first button in the upper chart toolbar. Expand Drawings, click a row to select its object, and double-click to open its settings. The row’s lock protects that object, the eye changes visibility and X removes it. Indicators and active chart overlays have their own groups, so you can find an item even when objects overlap in the plot.
Remove the intended object
Use the selected object’s trash button or its row’s X for one drawing. The trash control at the bottom of the left toolbar has a separate removal menu for broader actions; inspect its scope before using it. Hiding an object is the reversible way to reduce clutter while preserving its anchors and settings. Chart: navigation, controls and settings · Add and manage indicators · Reuse panel settings